Hunting for Insight is a series where we look at common results from Moldflow simulations. Whether you are a full time Moldflow analyst, occasional user, or are a program manager that reviews a handful of reports a year, the goal of this series is to provide valuable context for the different results, and explain how they can be used to provide actionable insight when you are designing your plastic part, or injection mold. This installment focuses on the Fill Time result, where we delve into understanding Fill Time Moldflow to answer questions like, “Can I fill my part?”
The Power of the Fill Time Plot
The Fill Time result is a dynamic plot that animates the predicted filling pattern of the molten plastic for a given part geometry, gate configuration, and resin. While it may appear relatively basic, it lays the foundation for decisions regarding feed system selection, venting, and parting line. Understanding this output is essential for engineers aiming to optimize gate locations, establish process feasibility, and minimize issues like jetting, short shots, air traps, weld lines, flow hesitation and race-tracking that can lead to performance or cosmetic issues for your part. The result is available for all three mesh types; midplane, dual domain, and 3D, and is produced during a “Fill” analysis.
The Fill Time Result: What is it?
The default Fill Time plot provides a prediction of how a molten material will fill a cavity with a given gate location and material. The plot can be dynamically updated to provide similar insight to a short-shot progression during mold qualification. However, we can get this insight prior to having a mold built. This ability allows for better decisions to be made earlier in the design cycle, as it relates to gate location, part geometry, and material selection. This helps save time and money in the product development process.
The flow front progression can be viewed using a shaded ‘rainbow’ color plot, or using contour lines, Figure 1. Each plot style has its own unique benefits, but represents the flow of plastic into the mold cavity at regular intervals over the specified fill time.
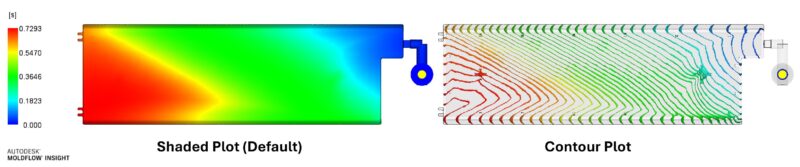
Figure 1. Fill Time plot shown in both styles, the default shaded plot and the contour line plot.
Filling Plot Styles: Shaded vs Contour
The shaded fill time plot provides the closest representation to a short-shot progression, and allows those less familiar with simulation the best visual for seeing how the material fills the cavity. The shaded plot is meant to be animated, and is often the best way to identify if there will be any short shots, air traps or weld lines.
Alternatively, the Fill Time plot can also utilize contour lines to represent the flow progression. Utilizing contours can be more beneficial in picking up on variations in flow front velocity. Each contour line indicates a snapshot of the flow front’s position at a specific moment in time, meaning the spacing of the contours reflects how far the melt has traveled during each equal time increment.
- Tight spacing between contours indicates slower flow, or hesitation, suggesting more resistance or thinner geometry in that region of the part.
- Wide spacing between contours indicates faster flow, or race-tracking effect, where the melt front travels a greater distance in a given time interval.
The visual feedback from the contour line setting makes the Fill Time plot a powerful tool for evaluating the relative speed of the advancing flow front that could lead to variable surface aesthetics and gloss. Additionally, the contour method can be a great indicator of variable degree of fiber and molecular orientation that could later influence the performance of your part.
What it Tells You?
Design Feasibility: Will My Part Fill?
Fundamentally, the Fill Time plot can be used in the early design stages to verify if the cavity will fill. If the cavity does not fill, often referred to as a short shot, that section of the model will not exhibit any color and will appear translucent. Designers can check the thinner regions of the part and the end-of-fill locations for any translucent areas that suggest a design or material change is needed. Such insights give designers confidence in the processability of their part designs before even needing to engage a molding or tool making supplier.
Early Steps in Design Optimization: Gate Location
As designers, we want to select a gate location that avoids changes in flow direction, and fills the end of the cavity at the same time. Such a filling pattern is often referred to as unidirectional and balanced, and is driven based on the number and location of the gates. Balanced fill will generally lead to parts that will shrink more uniformly and tend to have less warpage. Achieving a balanced fill pattern can also be important for minimizing the injection pressure and clamp force requirements to widen the processing window, reduce energy costs or fit a tool into a certain press. In a fill time plot, this often appears as the entire perimeter of the part all being red.
The Fill Time plot can help evaluate if the balanced and unidirectional filling pattern is best achieved by positioning the gate along the parting line or on top of the part. Such information helps drive decisions into different style molds, that could potentially add cost to the project or piece price. Understanding where the gate should be placed during the early part design stages helps designers manipulate part features, split lines and parting lines to allow for less complex tooling and more simple feed system designs. Learn more about gating here.
Avoid Performance Issues: Weld Lines and Air Traps
The Fill Time plot can be used to identify the location of weld lines in our part. Weld lines are artifacts of the filling pattern that typically result in reduced mechanical, chemical and aesthetic properties in our molded part. Weld lines form where flow fronts converge, typically after flowing around core pins. Therefore, weld lines are commonly located adjacent to through-holes, windows, bosses and between tightly spaced ribs. Weld lines can also form between gates on multi-gated parts. By animating the Fill Time plot, the designer can understand where the weld lines will form in their part and ensuring that they are not in high stress areas of the part.

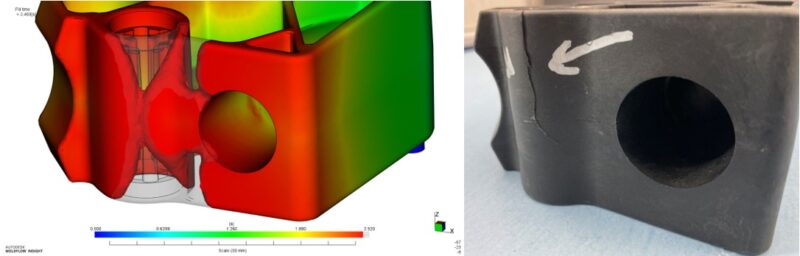
Figure 2. Shows the predicted filling pattern around a boss that lead to a weld line that caused cracking.
As previously stated, the Fill Time plot can be used to identify the end-of-fill locations for your part. Ensuring the end-of-fill locations are positioned either along the parting line or in areas that can be vented will help minimize the potential for short shots in features like deep ribs or bosses. The Fill Time plot can also highlight to a designer if any race-tracking or flow hesitation could lead to a potential air trap in the body of the part that would result in burning or poor part performance. Identifying any difficult to vent air traps can help lead to early part and mold design changes that will minimize any mold rework.

Figure 3. Shows the fill time plot picking up on an air trap that was causing a burning defect.
Figure 4. Shows an air trap that was caused by hesitation in the center of the part as the melt race-tracked through the thicker perimeter. Notice how the tighter contours in the center and wider contours on the edges are seen more easily in the contour plot.
While the Fill Time plot provides powerful visual cues on its own, it can be helpful to translate those visuals into practical design takeaways. The table below serves as a quick reference guide, linking what you might see in the plot to the underlying issue and potential corrective actions. Think of it as a bridge between recognizing a visual pattern and knowing what levers to pull in design, gating, or processing to address it.
Table 1: Quick Reference Table for Common Issues and Potential Fixes Addressed With Fill Time Plot.
Issue |
What To Look For |
Common Fixes |
Short Shot |
Translucent areas near ends-of-fill or in thinner walls | Add or move gates, increase wall thickness, change resin, increase fill speed, increase pack pressure |
Unbalanced Fill |
Non-uniform (non-red) color contours in the perimeter of the part | Adjust gate location, add flow leaders |
Non-Unidirectional Filling Pattern |
Flow not in one primary direction across part, asymmetrical contours, converging flow fronts | Adjust gate location, add flow leaders, modify wall thickness |
Hesitation |
Tightly spaced contours | Add flow leaders, modify wall thickness |
Race-tracking |
Widely spaced contours | Restrict flow, decrease thickness of contributing features |
Weld Lines |
Converging flow fronts near holes, bosses, windows or ribs | Reposition gates, redesign part features, add flow leaders |
Air Trap |
Translucent areas near ends-of-fill, the tops of boss and rib features, and in thinner walls and part features |
Change gate location, modify wall thickness distribution, add flow leaders or restrictors, increase fill speed |
Summary
The Fill Time plot is one of the most fundamental and intuitive outputs of a Moldflow analysis. It provides a time-based snapshot of how molten plastic fills a mold cavity, helping engineers predict issues like short shots, weld lines, air traps, jetting, and flow hesitation. By visualizing the progression of the flow front, designers can assess whether a part will fill properly, identify potential problem areas, and optimize gate and part thickness to improve part quality and manufacturability. Whether used to guide part design, tooling strategy, or material selection, the fill time plot is a powerful tool for de-risking decisions before steel is cut.