Getting accurate warpage predictions is one of the biggest drivers for integrating injection molding simulation, Moldflow®, into the part and mold design process. Yet it can be one of the most difficult results to match between the virtual and physical world. Autodesk Moldflow recently developed a new warpage model, STAMP, that helps improve the warpage predictions. This article will review the STAMP model, and will compare it to other warpage models previously used, like CRIMS®.
What is STAMP?
STAMP is an acronym that stands for Shrinkage Test Adjusted Mechanical Properties. It is the newest warpage solver, exclusively available for Autodesk Moldflow, that uses measured shrinkage data and improves the warpage predictions when using a full 3D solver to simulate the injection molding process of thermoplastic resins. STAMP works by building off the measured shrinkage data used in the CRIMS® model previously released by Moldflow®. Read more here about the CRIMS® model. However, the correction method is slightly different in that the STAMP model corrects the thermomechanical properties of the plastic resin, principally the coefficient of thermal expansion (CLTE) and the modulus. The STAMP model can be used for both filled and unfilled thermoplastic materials. If the material is filled, it should be noted that the adjustments made to the mechanical properties are only to the plastic matrix component.
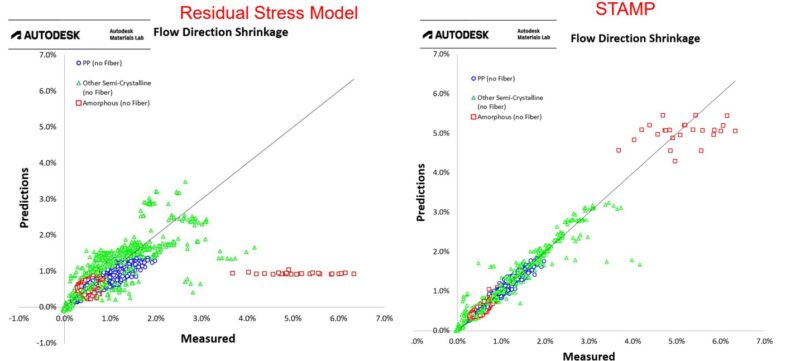
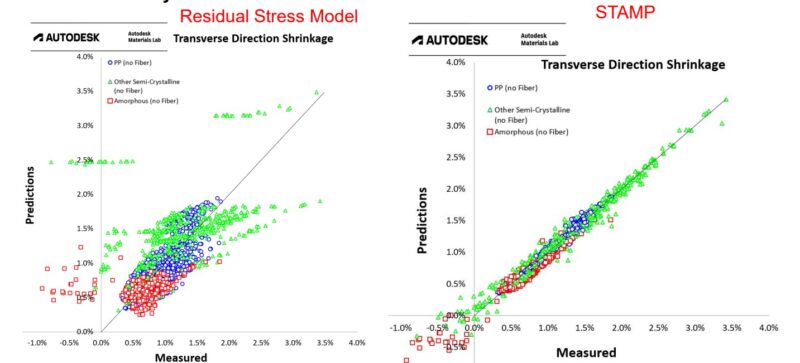
Figure 1: Scatter plots of measured vs simulated shrinkage for unfilled thermoplastic resin showing the improved correlation with the new STAMP model, as compared to the legacy Residual Stress Model. (Images taken from Moldflow Research & Development Updates from Franco Costa 2026, link to Summit here).
As shown in Figures 1 and 2, the implementation of the STAMP model helps improve the shrinkage correlation between simulation and actual molding when compared to the previously used uncorrected residual stress model for the 3D solver. The figures show the measured shrinkage in both the flow direction and transverse, or cross-flow, directions. Comparing the images on the left to those on the right, highlight that the datapoints lay more closely to the black line. The black line would represent a 1:1, or perfect, correlation between simulated and measured shrinkage data. Therefore, the closer the points are to the black line, the more accurate the shrinkage predictions. The better correlation will lead to more accurate warpage predictions in our simulations. Such improvements mean that analysts and designers can more easily use the simulation data to extract warpage modes and magnitudes to implement anti-warp, or windage, into their CAD models before parts are even shot.
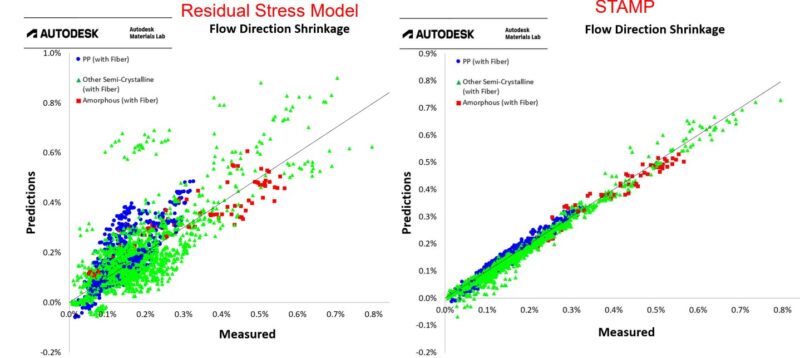
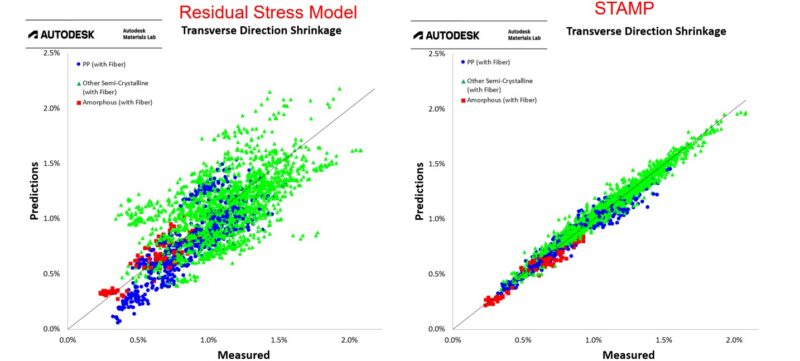
Figure 2: Scatter plots of measured vs simulated shrinkage for fiber-filled thermoplastic resin showing the improved correlation with the new STAMP model, as compared to the legacy Residual Stress Model. (Images taken from Moldflow Research & Development Updates from Franco Costa 2026, link to Summit here).
What variables does STAMP account for in my model?
The STAMP model uses the same shrinkage data that the CRIMS® model has used over the last 30 years. The data is generated by molding a 40 mm X 200 mm end-gated plaque at different process conditions, Figure 3. The variables that can be selected and tuned for the model include:
- Three different plaque thicknesses. The plaques are molded at thicknesses ranging from 1.00 mm to 5.00 mm.
- Three different melt temperatures
- Three different injection speeds
- Three different packing pressures
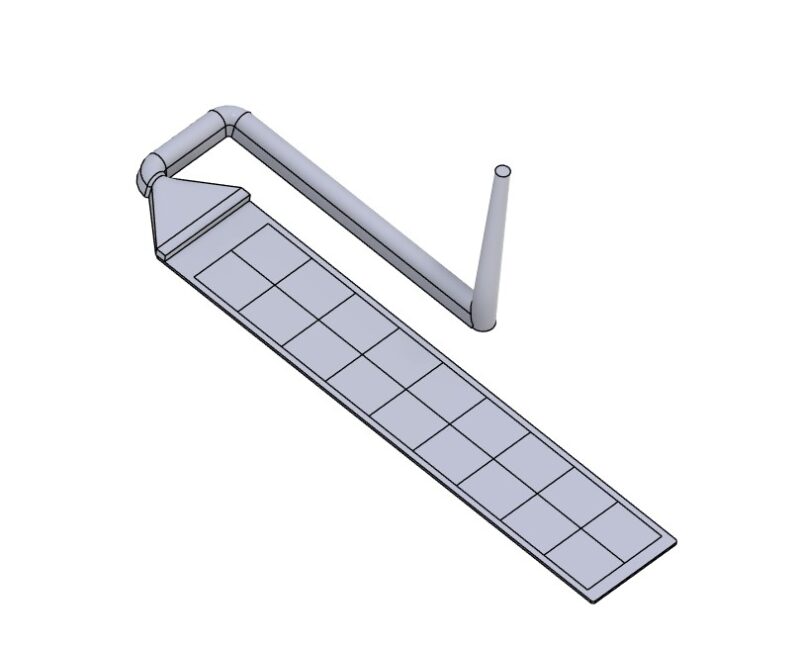
Figure 3: Schematic Representation of a Shrinkage Plaque Used for Generating the Data for the STAMP and CRIMS® models.
Based upon the variable level selected, 25 different populations of plaques are molded that are measured for shrinkage in the flow and cross-flow directions. These shrinkage measurements are used to generate the coefficients needed for both the CRIMS® and the STAMP models. This measured shrinkage data allows for any post-mold shrinkage or moisture absorption to also be accounted for so more accurate shrinkage data can be generated in simulation. Incorporation of these additional factors is particularly important for polyamide resins, and semi-crystalline resins with a low glass-transition temperature, such as polypropylene, polyethylene, and polyacetal.
Is STAMP different than CRIMS®?
STAMP is not replacing the CRIMS® model, but rather extends the usefulness of the measured plaque shrinkage data to the full 3D solver used in the Autodesk Moldflow package. The CRIMS® model, as previously explained in this post, has historically only been able to use the measured shrinkage data to the midplane or dual domain solvers. Generally, this has required certain geometric parameters like consistent wall thicknesses, and well defined feature geometry that is not always suitable for all injection molded components. The STAMP model uses the same data but implements the corrections slightly differently. However, the result is the same in that the use of both warpage models will result in more accurate shrinkage and warpage results.
How do I know if I’m using the STAMP model?
The STAMP model is integrated into the material file for the injection molding simulation. If a simulation is being performed, the analyst or designer can navigate to the shrinkage properties tab. On that tab, you can see that the “selected shrinkage model (3D)” would be set to STAMP, Figure 4. On this tab, you can also see the variables selected to generate the model. It is important that the variables, such as wall thickness, are representative or bracket your actual geometry file.
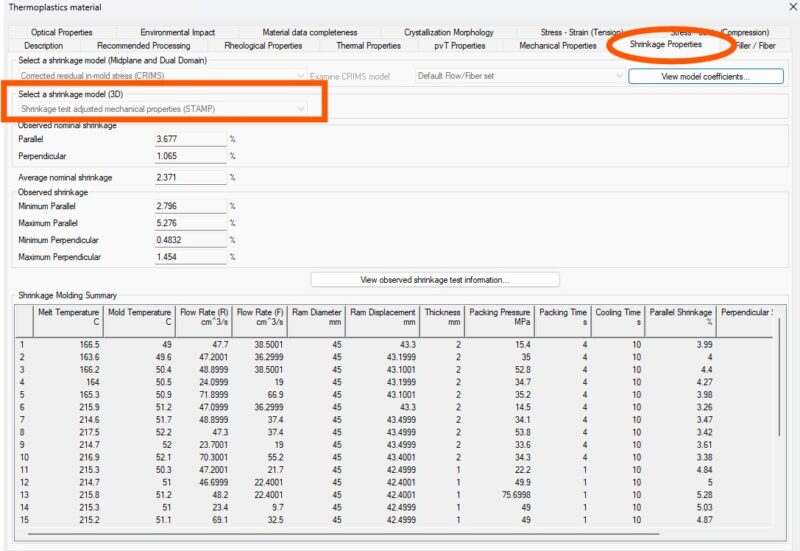
Figure 4: The STAMP and CRIMS model data is found on the Shrinkage Properties tab for the material card file.
Do I need STAMP to get accurate warpage results?
While having the STAMP data for your material will help ensure you are getting accurate warpage predictions, it is not always necessary. Good results can still be achieved without this data, if the rheological (flow), thermal, and mechanical characterization are good for the resin. If the simulation objective is to determine accurate shrinkage and warpage then it is highly recommended to have this actual measured data. This is particularly true for materials that will experience post-mold shrinkage, like polyolefin resins and acetals. It is also very useful for both filled and unfilled polyamides (nylons). Having a conversation with your analyst at The Madison Group prior to any analysis can help ensure that the level of characterization is appropriate for your simulation needs.
Feel free to reach out to us, with any further questions you may have regarding Moldflow simulations and material characterization.
Don’t have your material characterized for simulation? Read this post about important parameters to compare.