Problem: For an injection molding application, a PC/PBT resin was chosen. However, as this specific material lacked the necessary material characterization for simulation within Moldflow, the material supplier recommended a “drop-in” substitute, citing its equivalence on their line card. While the initial analysis focused on gating configuration and warpage prediction, the customer later requested linear shrinkage values for tool cutting. This analysis, intended for injection molding simulation, immediately highlighted a critical issue: the substitute material, despite being labeled as equivalent, exhibited significant differences from the original PC/PBT. As demonstrated in Table 1, a comparison of the materials revealed the substitute to be a higher molecular weight resin, indicated by a lower melt flow volume. This discrepancy underscores the vital importance of accurate material characterization for simulation. Relying on “drop-in” substitutes without proper data can lead to inaccurate predictions and potentially costly tooling errors. Thorough material characterization is paramount to ensure reliable simulation results and ultimately, successful product development.
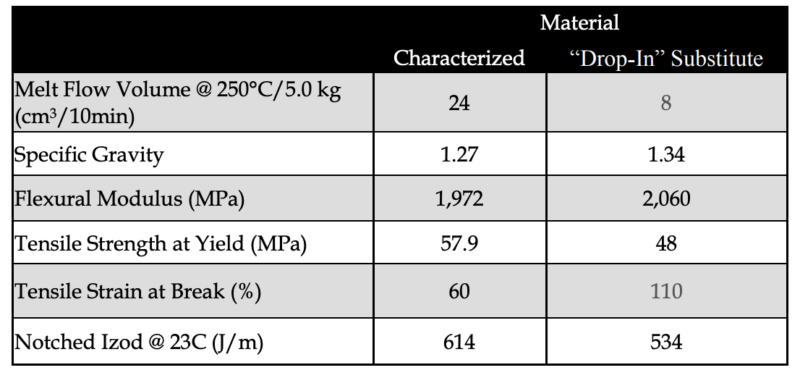
Table 1. The table highlights the material differences between the characterized and Drop-in substitute materials.
Evaluation: During the evaluation of the part and process, the simulation with the substitute resin showed reasonable filling parameters. The substitute resin was able to capture the filling pattern and balance of fill. Additionally, the pressures did not raise any concern during the preliminary analysis with only the substitute resin. The predicted filling pattern was similar to that of the characterized resin, as well as similar to short-shots taken at the press. However, during the warpage analysis, excessive amounts of warpage and shrinkage were predicted. These values were far greater than expected based on the geometry and previous experience with PC/PBT resins. Therefore, there was little confidence in the predicted data in regards to dimensional stability by both The Madison Group and the customer.
With this lack in confidence regarding the data, the resin supplier ultimately decided to have the material characterized for simulation. The Madison Group characterized the resin and fit the material data to generate the newly characterized material file. The characterized resin was then used in simulation with the process settings that were established for the substitute resin (Case 2).
The “Drop-in” substitute resin (Case 1) and the newly characterized resin (Case 2) used the same process settings, but simply changed the materials, Table 2.
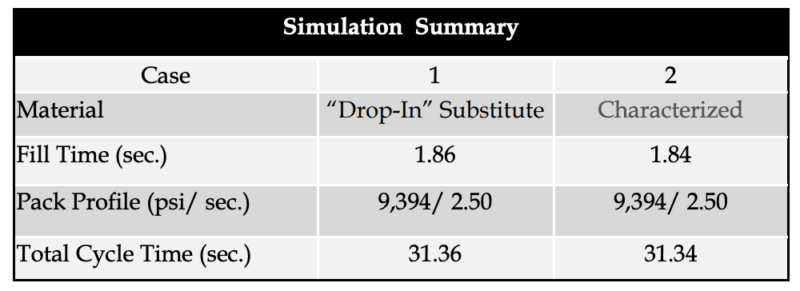
Table 2. Overview of the processing parameters used for Cases 1 and 2.
This comparative analysis highlighted a few major findings. The predicted pressures to fill the cavity were much higher than with the “Drop-in” substitute resin, Figure 1. This may seem counterintuitive based on the melt flow volume data. However, after looking into the rheological (viscosity) data, the shear thinning behavior seemed to support the findings corresponding to the increase in pressure with the characterized resin. This further supported the fact that these materials are inherently different. Additionally, it is important to note that while spending time at the press with the customer, the observed pressures tended to range between 22,000—25,000 psi. This helped create greater confidence in the simulation results with the characterized resin.
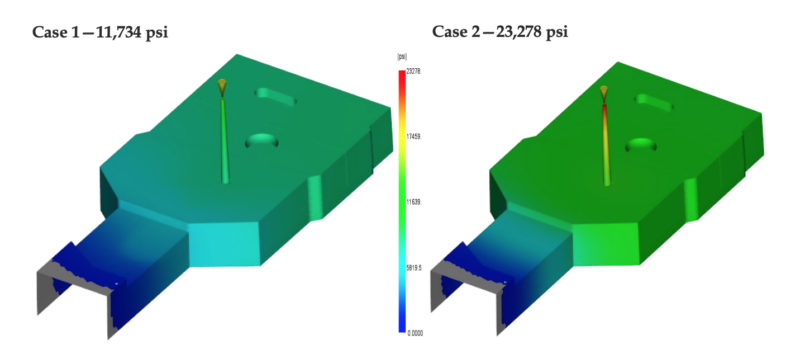
Figure 1. Plot showing the pressure distribution at switchover for Cases 1 and 2.
Along with the difference in pressures observed during filling, the difference in predicted warpage was drastic. The only change made between Cases 1 and 2, was the resin characterization. The drastic change in warpage showed that the newly characterized resin was predicted to deflect significantly less with respect to the length and width of the part, but showed an increase in the out-of-plane deflection, Figure 2.
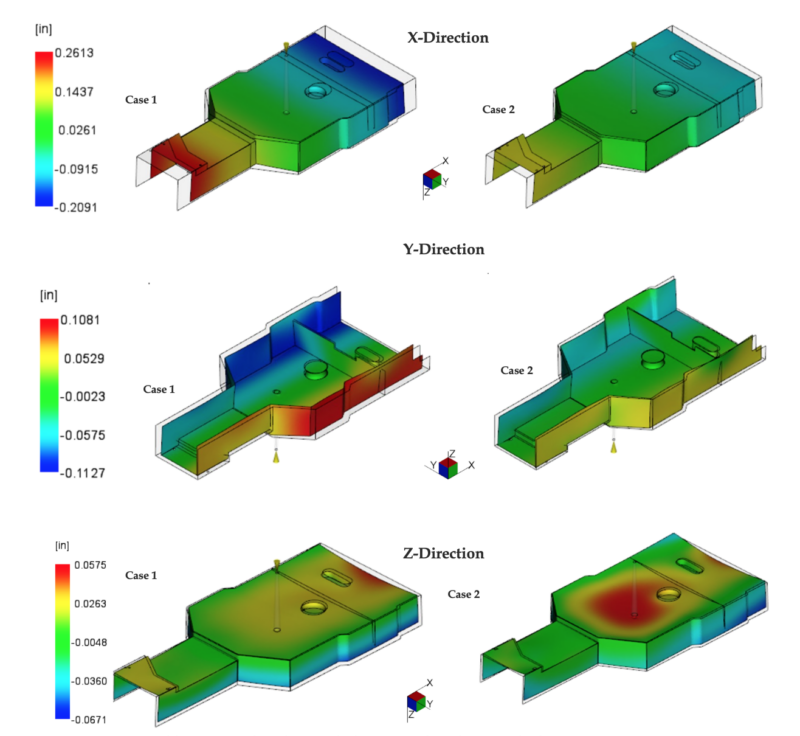
Figure 2. Comparison of the warpage modes and magnitudes for Cases 1 and 2 in the X, Y, and Z directions.
The increase in volumetric shrinkage under the sprue and the increase in the out-of-plane deflection on the same face suggested that the newly characterized resin had the ability to be packed for a significantly longer time than the “Drop-in” substitute resin. With this newly found information regarding the characterized resin’s packing behavior, the process settings were optimized around the newly characterized resin. (Case 3). This optimization resulted in a packing time that increased from 2.5 seconds to 10 seconds. That is a 4x increase in the packing time, which has the potential to greatly impact the dimensional stability of the part. The warpage for Case 3 is shown below in Figure 3.
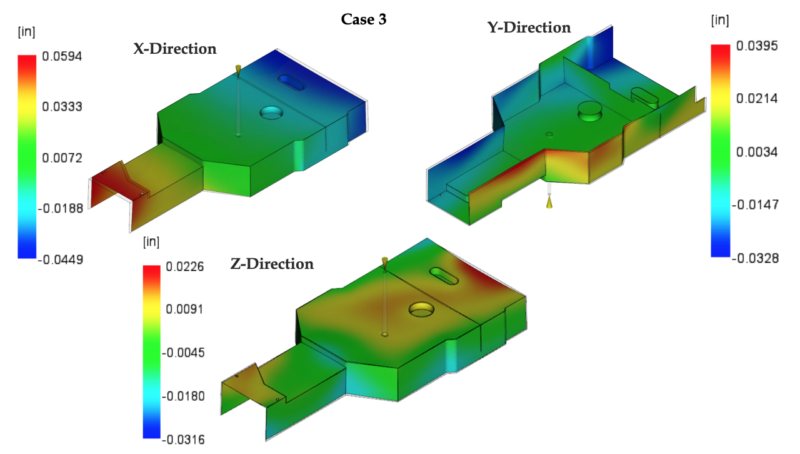
Figure 3. Comparison of the warpage modes and magnitudes for Case 3 in the X, Y, and Z directions.
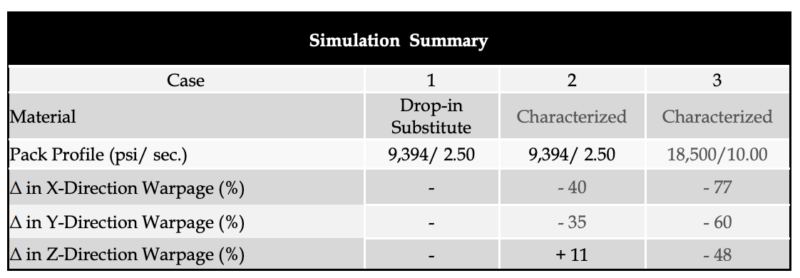
Table 3. Table showing the magnitude of improvement that can be made by changing both of the materials and adjusting the process for the new material.
The customer had also expressed an interest in linear shrinkage, as they would like to use the simulation as an aide while cutting their tool. See below for a comparison of the theoretical linear shrinkage values in Table 4.
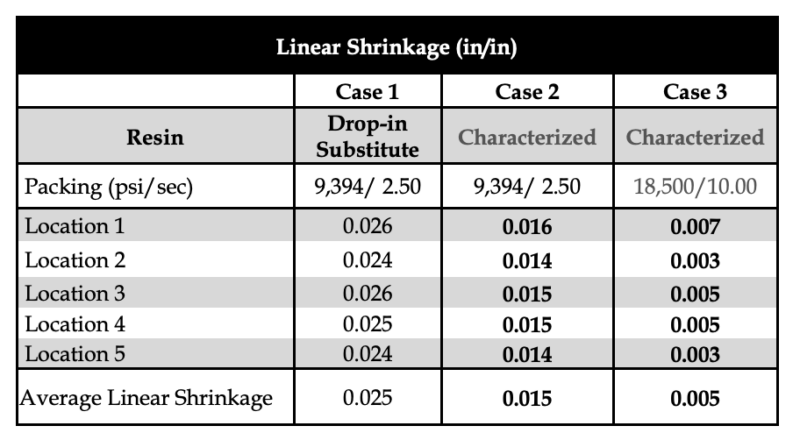
Table 4. A table showing the linear shrinkage rates for the cases in this study.
The corresponding locations that the measurements were taken from are shown in Figure 4. The listed shrinkage on the data sheet for the resin was 0.006-0.010 in/in. The theoretical values obtained from the characterized resin are much more representative of the resin than the “Drop-in” substitute.
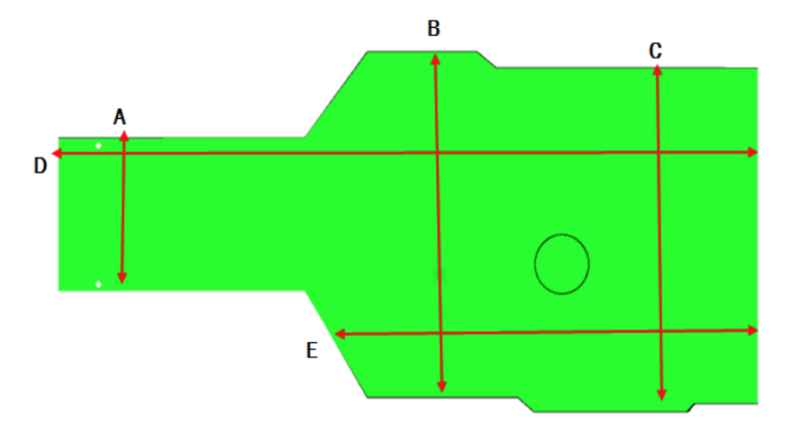
Figure 4. An image showing the locations of the linear shrinkage measurements taken on the models in Moldflow.
Conclusion: To ensure accurate and reliable simulation results, especially when using substitute resins, it’s crucial to go beyond the basic data provided on a material datasheet. While short-term properties may appear similar, long-term performance and subtle variations in material composition can significantly impact simulation outcomes. This is particularly true for complex material blends like PC/PBT or PC/ABS. Therefore, The Madison Group strongly emphasizes the importance of comprehensive material characterization for simulation. Investing in thorough material characterization upfront can save time, reduce costs, and prevent potential issues during tool design and manufacturing. By accurately capturing the material’s behavior, simulations can better predict real-world performance, leading to more robust and efficient product development.
This article was originally authored by John R. Nebbia.