There are many benefits to performing a non-destructive, visual analysis prior to destructively testing a part. In some cases, non-destructive testing could completely solve your problem. In other cases, it will provide a springboard to destructive testing. The first article in this two-part series focused on conducting a non-destructive, visual analysis of a failed travel mug. The goal of this article is to verify the conclusions of the non-destructive analysis with destructive testing of the travel mug. In addition to this goal, we would also like to further determine if destructive/analytical tests can answer those questions left inconclusive.
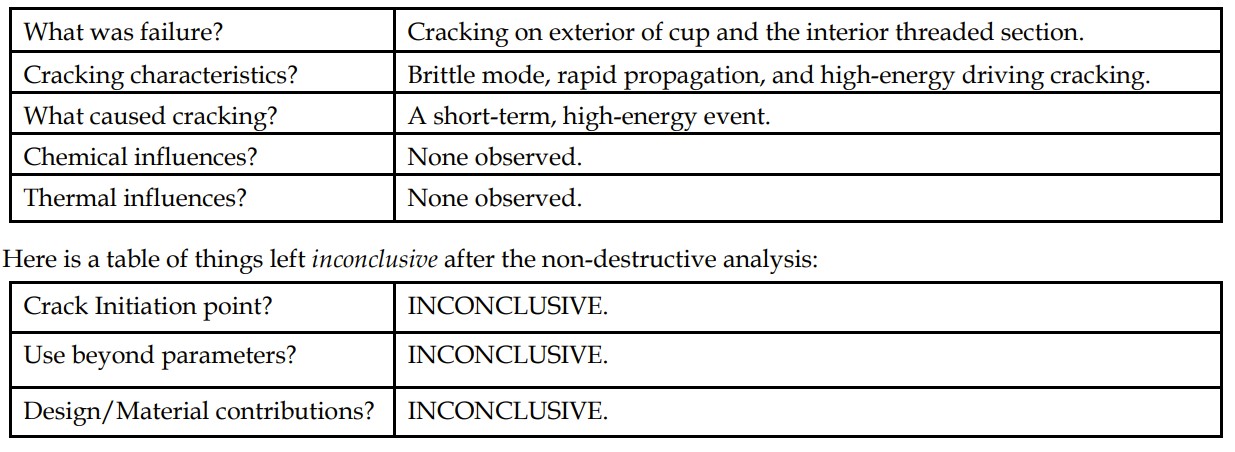
If you have not read the first article, you can link to it here: The Benefits of a Non-Destructive Visual Analysis: A Case Study. For reference, here is a brief table of what we knew and followed by what we did not know from the non-destructive analysis:
Destructive Sectioning of the Travel Mug
The first goal of destructive testing was to expose both of the cracks in the travel mug (a flowchart is shown in Figure 1. The transverse crack and axial crack surfaces were both exposed for visual, microscopic, and SEM analysis. In addition to exposing the fracture surfaces, a section of the mug with an intact weld was longitudinally cross-sectioned and potted in order to view the weld and internal geometries of the travel mug.
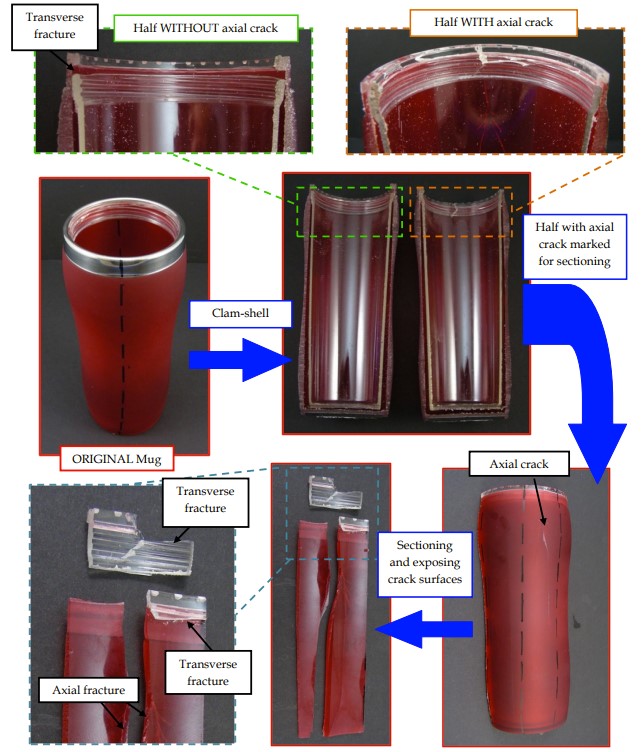
Figure 1 – Flowchart of the destructive sectioning for the travel mug.
Viewing the Transverse Crack Surface
The transverse crack in the clam-shelled half without the axial crack was viewed with a digital microscope (Figure 2). There are two distinct sections within the transverse fracture. The sections on the cut ends of the clam-shelled half showed a jagged/sporadic fracture surface, while the middle section was relatively flat and appeared to follow the transition below the weld. The fracture in the cut end sections was evidently brittle in nature with little ductility. This fracture surface showed relatively large river and hackle marks, which are indicative of a rapid fracture that has high energy. In the middle section, the fracture surface appeared brittle in nature with light ductility in some fracture features. At first, the features looked similar to banding, which is typically associated with slow crack growth. However, at higher magnifications with the digital microscope, the surface showed numerous fracture planes and rapid fracture features. In contrast, slow crack growth would most likely leave significantly, more smooth and fine features. Therefore, this showed that while the middle section was a rapid fracture, it could have had slightly less energy than in the cut ends of the transverse fracture.
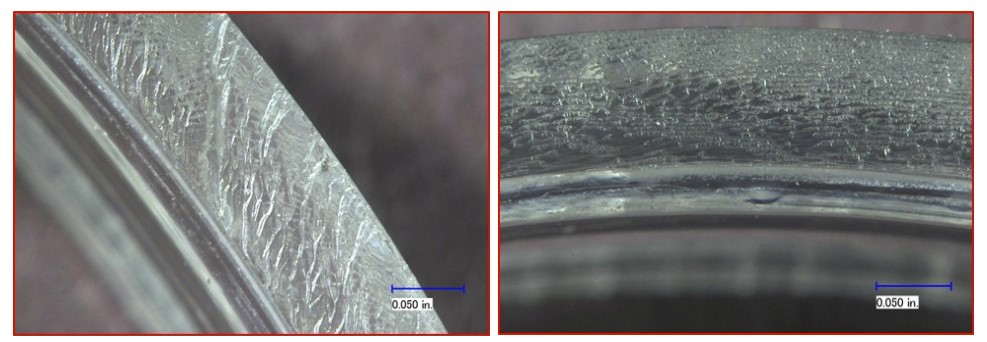
Figure 2 – Micrograph views of a cut end section (left) and the middle section (right).
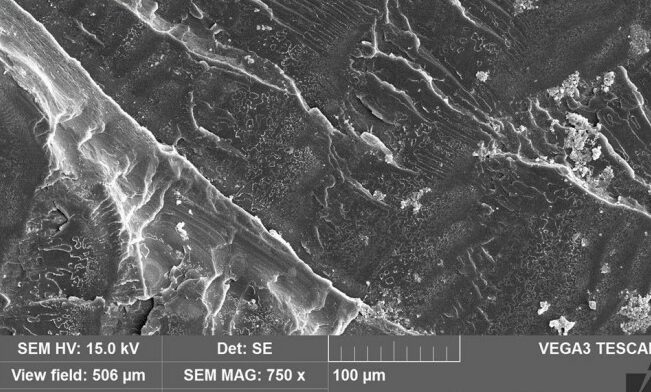
Figure 3 – SEM view of a cut end section of the transverse fracture.
Both distinct sections of the transverse crack were viewed with a scanning electron microscope (SEM). The end sections showed a fracture surface that was characteristic of a rapid and high-energy fracture (Figure 3). There were river markings and hackle marks showing the fracture moving from the bottom right to upper left-hand corner of the image. While there was some micro ductility in the crack unions, there were little to no signs of any macro ductile stretching of the polymer during cracking. When viewed with an SEM, the “relatively flat” section of the transverse crack showed a fracture similar to the end sections in the sample. There were slightly larger areas between fracture features, but the features were similar in nature. In both sections, there were no signs of any adverse chemical/environmental effects that had contributed to cracking in the mug. Overall, the transverse crack showed a brittle and high-energy failure with rapid fracture features. This was observed with both the digital microscope and SEM. This confirms the conclusions in the non-destructive analysis regarding the transverse crack. There was nothing observed in the transverse fracture that showed it was not due to a short-term, high-energy event.
Viewing the Axial Crack Surface
Due to the metal ring around the top of the travel mug, it was difficult to tell during the non-destructive analysis whether the axial crack in the internal cup was the same crack as in the outer housing. During destructive testing we are able to expose the axial fracture surface and determine that the internal cup and outer housing shared the same axial crack. The half of the axial crack with an intact weld was examined to observe the features near the weld area.
The axial crack surface in the outer housing showed features that were characteristic of a short-term, high energy failure (Figure 4). Much like the transverse crack, the fracture surface appeared to be brittle in nature with rapid fracture features such as hackle marks. The fracture features appeared to propagate from the top of the outer housing down to the bottom of the crack. When viewing the axial crack near the weld with a digital microscope, it appeared that the crack initiated within the internal cup very near to the weld between the two parts. This was observed as the fracture features in the outer housing appeared to extend from a single point right over the weld. This was overturned when viewed with an SEM. At that point in the analysis, it was thought that the crack was likely initiating from around the weld in the part, but the part was viewed with an SEM to confirm the crack initiation area.
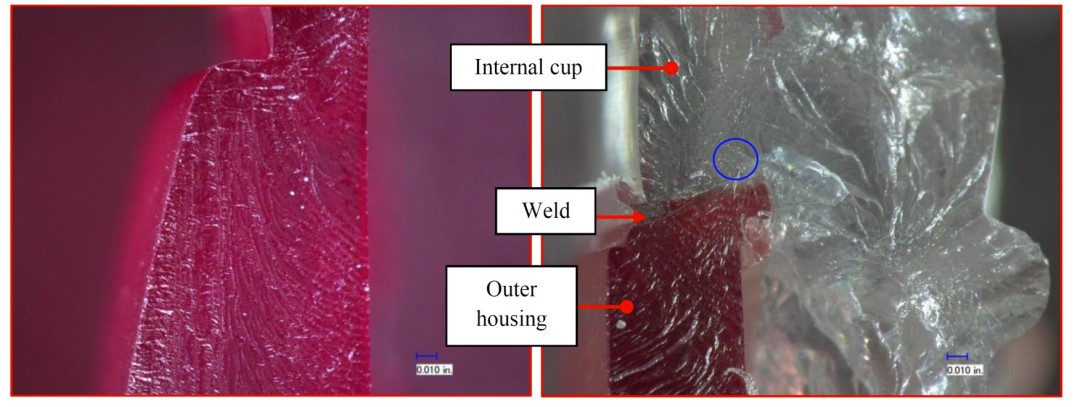
Figure 4 – Micrograph views of the axial crack near the weld (left) and in the outer housing (right). The “secondary initiation” point is marked with the blue circle.
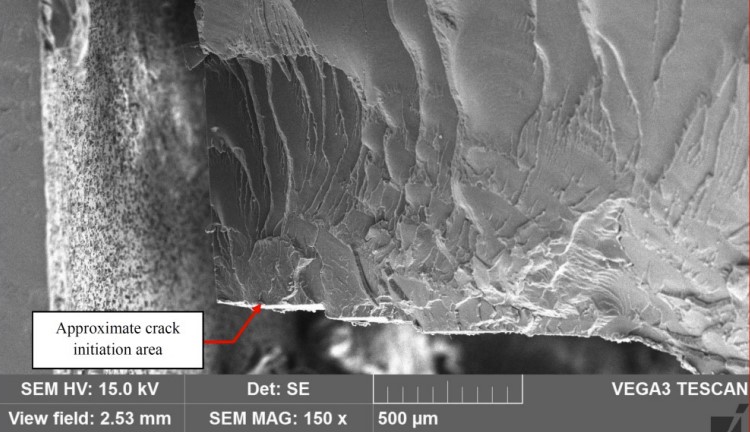
Figure 5 – SEM view of approximate crack initiation area.
While it appeared that the axial crack initiated at/near the weld with a digital microscope, it was obvious with an SEM that this “secondary initiation” grew out of a fracture propagating from the internal cup. Upon further searching, the approximate area of crack initiation was observed in the internal cup adjacent to the transverse crack (Figure 5). From the crack initiation area, the crack propagated up and around the internal cup, crossed through the weld, and propagated down the outer housing. It is pertinent to note that due to the location of the approximate crack initiation area, the sample would have to be further sectioned to directly view that area with higher magnifications.
Exposing the axial crack surface confirmed the conclusions from the non-destructive analysis about the axial crack. Additionally, it gave a more precise area of crack initiation.
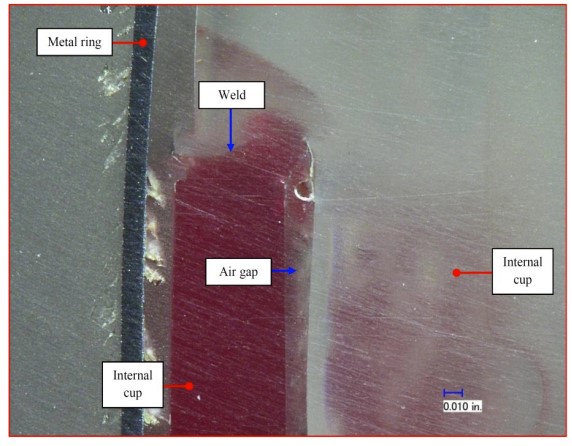
Figure 6 – Micrograph view of the cross-sectioned travel mug.
Cross-Sectioning of the Travel Mug
The potted portion of the mug was cross-sectioned and polished in order to view the weld area and threaded section (Figure 6). While the weld between the two parts appeared to have decent mixing of the materials, the intentional air gap between the sidewalls of the parts would have likely decreased the overall strength of the weld area. This shows that the travel mug contained a less-than-optimal design near the weld. The transverse crack in the internal cup occurred completely below the weld in the internal cup. It is possible that the weld geometry decreased the strength of the part. Furthermore, the top of the gap between the parts could have acted as a stress concentration in the part, and increased the local stress in that area.
FTIR Analysis
Depending on the sample geometry FTIR can be either a non-destructive or destructive test. In this investigation destructive test methods were needed in order to obtain polymeric material from both the red outer housing and the clear internal cup. These materials were subjected to Fourier transform infrared spectroscopy (FTIR). As observed, there is a good match between the spectra for both the outer housing and internal cup (Figure 7). The absorption bands are characteristic with those of a styrene/ acrylonitrile (SAN) copolymer resin. The soft coating on the exterior of the red outer housing was also tested with FTIR. It showed absorption bands indicative of a thermoplastic elastomer material with ester and acrylic functionality. Overall, the FTIR analysis fits with what has been observed in the other tests. While there was nothing unusual found from the test in this case, FTIR can provide you with helpful information. Knowing what material you are working with can give you a better understanding of where to go with other tests, especially any thermal tests. Furthermore, it could also help to shed light on the observed behavior of the material during cracking/failure.
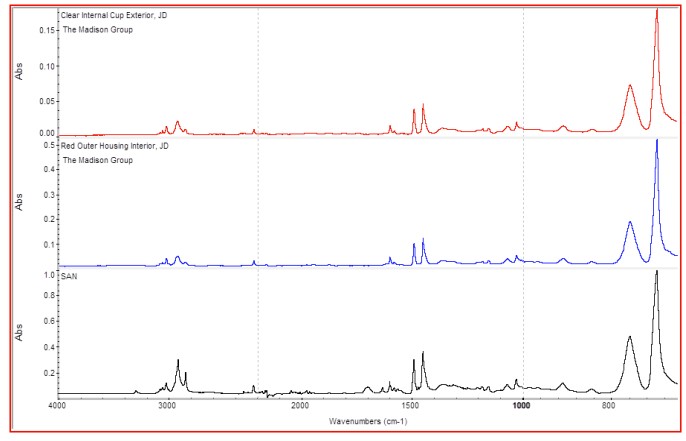
Figure 7 – View of the spectra for both the internal cup (top), the outer housing (middle) and their shared library match.
Conclusion
The destructive testing of the travel mug confirmed all the conclusions of the non-destructive analysis. The SEM examination confirmed that both cracks were rapid and high energy, and nothing observed disproved that this failure was due to a short-term, high-energy event (impact/drop). As far as answering the inconclusive questions, we were able to determine a more precise location for the crack initiation area. We also learned that the cross-section of the travel mug showed a less-than-optimal weld area, and that the SAN material of the mug correlates with what we observed in the fractography. At this point, we can definitively conclude whether the mug was subjected to a drop/impact beyond its design parameters, or the design/material of the mug contributed to failure. Extensive exemplar testing would likely need to be performed in order to have conclusive evidence answering those questions.
If there is one thing to take away from this series, it is that non-destructive analysis of a part is a powerful tool. While we learned more information about the failure and part when we included the destructive testing, we were able to figure out the destructively confirmed mode and manner of failure before cutting into the part. All in all, you cannot go wrong by taking the time to look at a failure non-destructively, before jumping into destructive tests.
The Benefits of a Non-Destructive Visual Analysis: A Case Study Part 1