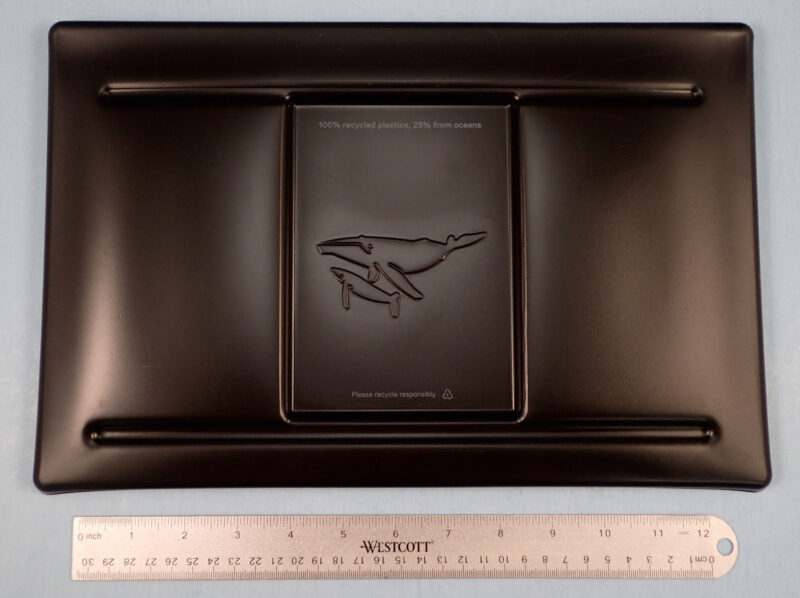
Figure 1. Laptop packaging indicating 25% ocean plastic content.
A New Year often equates to a new start. To celebrate, many of us decide to purge our clutter and organize our spaces. This year, during my annual purge, I came across old packaging materials from my work laptop. Within the box I found a thermoformed plastic cushion highlighting that it was made from 100% recycled plastics, 25% of which was from oceans, Figure 1. The recycling code further indicated a number 2, which is for a high-density polyethylene resin. It is difficult to separate mixed streams of recycled plastics, which are often done so by their density, especially polyolefins. To learn more about the composition of the packaging, a material analysis was performed.
Compositional Analysis
A variety of material analysis techniques were used to determine the composition of the thermoformed cushion. First Fourier transform infrared spectroscopy (FTIR) was run. This test is a qualitative analysis technique for organic and inorganic samples that identifies chemical bonds in a molecule by producing an absorption spectrum. The obtained spectrum represents a profile of the sample, a distinctive molecular fingerprint that can be used for characterization and identification. The resulting FTIR spectrum, Figure 2, revealed absorption bands consistent with polypropylene and polyethylene resin. Additional, relatively weaker absorbances indicated the presence of talc and calcium carbonate, i.e. Hubercarb Q-4. Talc and calcium carbonate are inorganic minerals often used as fillers in polymer formulations.
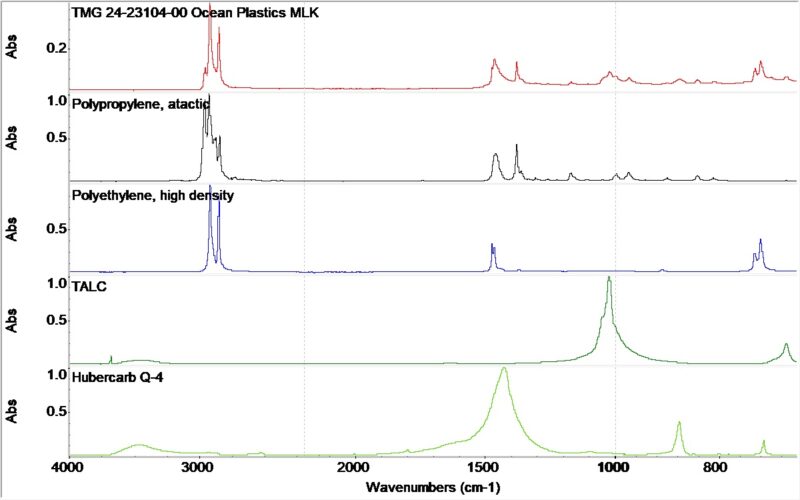
Figure 2. The FTIR spectrum obtained on the plastic packaging.
Next, differential scanning calorimetry (DSC) was performed. This test method evaluates how the material will react in response to heating and cooling. It can be used to determine thermal transitions associated with glass transitions, melting, and crystallization. In this analysis, a three-step program was employed whereby the sample was initially heated to well above the melting point, then control cooled through recrystallization, and subsequently reheated. The DSC thermogram obtained during the second heating run is shown in Figure 3.
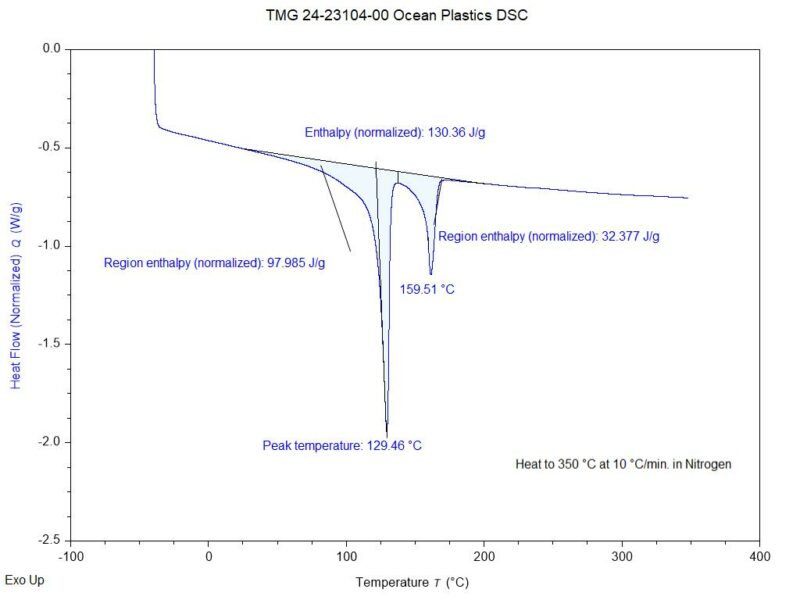
Figure 2. The DSC thermogram obtained on the plastic packaging during the second heating run.
A review of the results revealed two endothermic transitions, centered at 129.5 °C and 159.5 °C. The lower transition at 129.5 °C was characteristic of the melting point of a high-density polyethylene resin. The higher transition at 159.5 °C was consistent with the melting point of a polypropylene resin. Based on the enthalpy values of these transitions, it could be stated that the polyethylene content was much greater than the polypropylene content. That being said, it is not possible to determine the exact levels of the two resins using this technique.
Finally, thermogravimetric analysis was performed. This technique measures weight changes within a material as a function of temperature or time under a controlled atmosphere. In this investigation, the test results were used to determine a semi-quantitative assessment of composition, Figure 4.
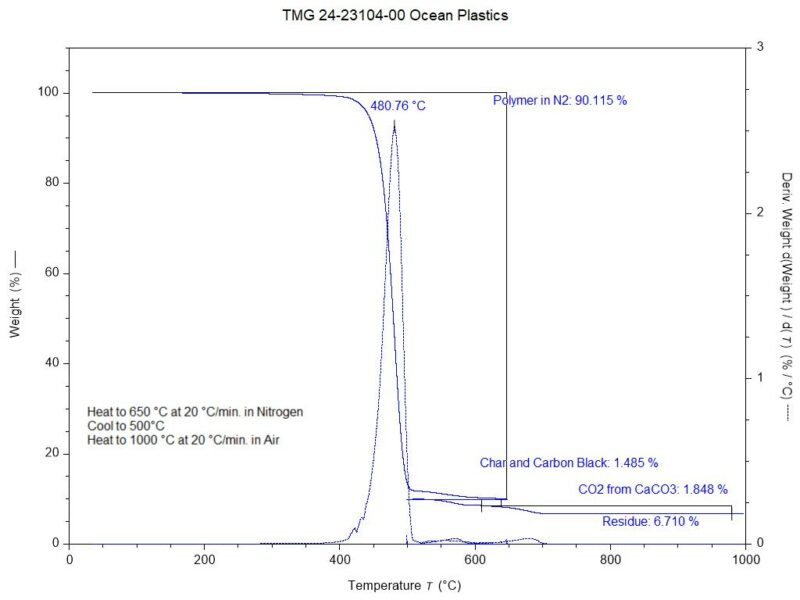
Figure 4. The TGA thermogram obtained on the plastic packaging.
During heating to 650 °C in a nitrogen environment, the sample underwent a 90.1% weight loss event centered at 480.8 °C. This weight loss was associated with the decomposition of the polyethylene and polypropylene resins. Upon conversion to an air environment, the sample experienced two weight loss events. The first, at 1.5%, was associated with the combustion of carbon-based char that formed during the initial polymer decomposition and possible carbon black. The second, at 1.8%, was due to the evolution of carbon dioxide that occurred during the decomposition of the calcium carbonate filler. A stoichiometric calculation was then be made to determine the calcium carbonate content at 4.2%. At the conclusion of the analysis, a noncombustible residue content of 6.7% remained in the form of particulate matter. The residue was composed of calcium oxide at 2.4%, a byproduct from the decomposition of the calcium carbonate filler. The remainder of the residue, 4.3%, was likely associated with the talc mineral filler.
Where Does Ocean Plastic Come From
Now that the composition of the packaging was understood. I wanted to learn more about where ocean plastics come from. Yes, they come from the ocean, but how does it really get there? Many ocean plastics come from land-based sources where approximately 70% to 80% of them are transported via rivers or coastlines to the sea. (1) The world’s largest emitting rivers of ocean plastics are predominantly in Asia, specifically Philippines, Malaysia, and India, as indicated in Figure 5.
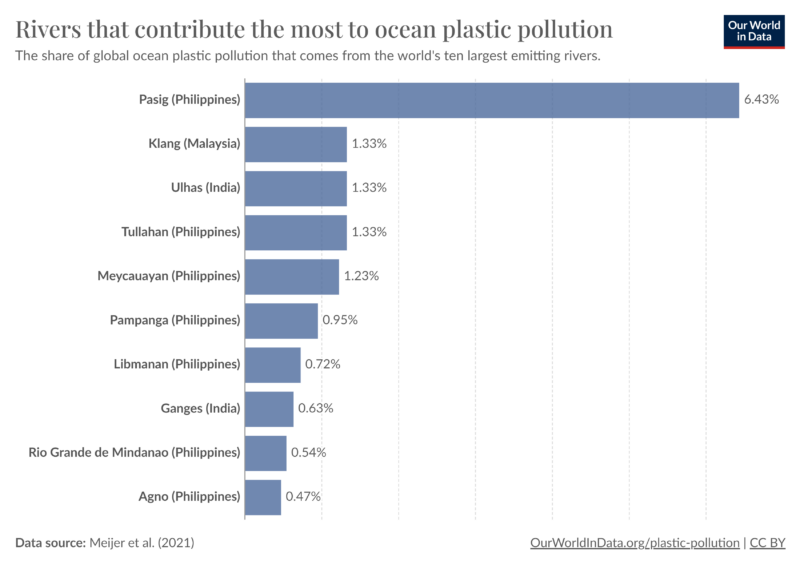
Figure 5. Rivers that contribute the most to ocean plastic pollution.
These high emitting rivers have several characteristics in common:
- Local waste management practices are poor, leaving a large amount of mismanaged plastic waste to enter rivers and the ocean.
- Have cities nearby with paved surfaces where water and plastic pollution can drain into river outlets.
- River basins have high precipitation rates, leading to high flow rates of rivers into the ocean.
- Close to the coast.
This data indicates that most ocean plastics are not coming directly from US rivers and coastlines. However, the US does export a significant amount of plastic waste globally, Figure 6. The export of plastic waste to countries without the infrastructure to appropriately handle it, such as India and Malaysia, Figure 7, are the primary way developed countries, like the US end up contributing to the problem of ocean plastics.
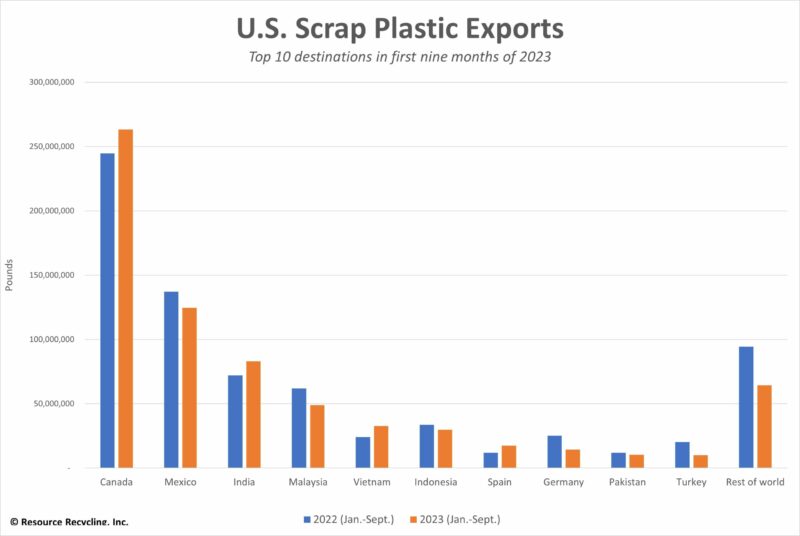
Figure 6. Indicates the top countries that imports plastic waste from the US.
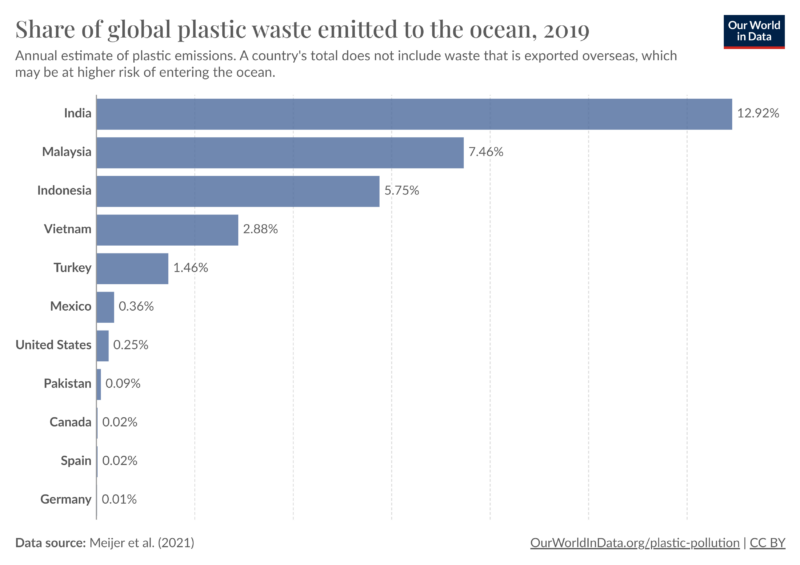
Figure 7. Shows how the top importers of US plastic waste contribute to creation of ocean plastic.
It has been reported that the most common polymers found in a ocean environment are low density polyethylene, linear low-density polyethylene, high-density polyethylene, polypropylene, polyethylene terephthalate, polystyrene, and polyvinyl chloride. (2) So it was not surprising that the laptop packaging containing ocean plastics consisted of a mixture of polyethylene and polypropylene resins along with mineral fillers.
To reduce the prevalence of ocean plastics, it is important that the US support developing countries in the improvement of their waste management infrastructure. The US should also take care and avoid exporting waste to countries where mismanagement has a high probability of emissions to the ocean and focus on exporting to those countries that are lower risk, such as Mexico and Canada.
(1) Li, W. C., Tse, H. F., & Fok, L. (2016). Plastic waste in the marine environment: A review of sources, occurrence and effects. Science of the Total Environment, 566, 333-349.
Lebreton, L., Slat, B., Ferrari, F., Sainte-Rose, B., Aitken, J., Marthouse, R., … & Noble, K. (2018). Evidence that the Great Pacific Garbage Patch is rapidly accumulating plastic. Scientific Reports, 8(1), 4666.
(2) Gallo F, Fossi C, Weber R, Santillo D, Sousa J, Ingram I, Nadal A, Romano D. Marine litter plastics and microplastics and their toxic chemicals components: the need for urgent preventive measures. Environ Sci Eur. 2018;30(1):13. doi: 10.1186/s12302-018-0139-z. Epub 2018 Apr 18. PMID: 29721401; PMCID: PMC5918521.