Poly(phenylene ether) and High Impact Polystyrene (PPE+HIPS) blends offer a remarkably adaptable plastic solution. By strategically combining the strengths of PPO resin and HIPS, this alloy allows for precise property tailoring through adjustments in the PPE to HIPS ratio, making it suitable for a wide range of applications.
Introduction
Poly(phenylene ether) (PPE) , also known as poly(phenylene oxide) (PPO), is an extremely versatile plastic. While PPE can represent a number of specific polymers, the most common structure commercially available is poly(2,6-dimethyl-1,4-phenylene oxide), a linear amorphous thermoplastic (Figure 1). This polymer is produced through condensation polymerization, oxidative coupling polymerization, step-growth polymerization from 2,6-dimethylphenol.

Figure 1: Molecular structure of poly(phenylene ether) (PPE).
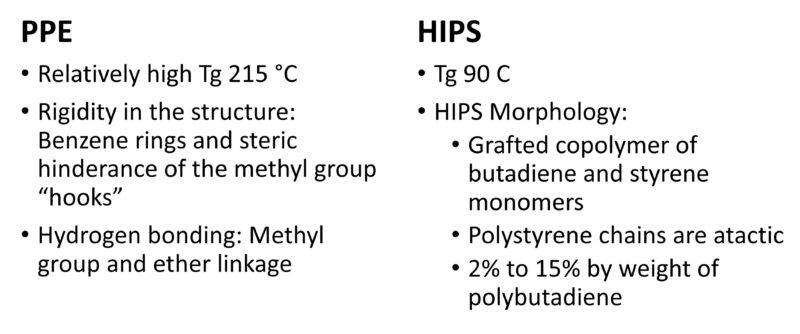
Functionally, PPE has a relatively high glass transition temperature, 215 °C, and from a practical standpoint is not melt processable. In order to enhance its processability, it is physically mixed with high-impact polystyrene (HIPS). HIPS is a graft copolymer with a two-phase structure (Figure 2). It has a continuous phase of polystyrene (PS) matrix and a dispersed phase of polybutadiene rubber particles with PS occlusions.
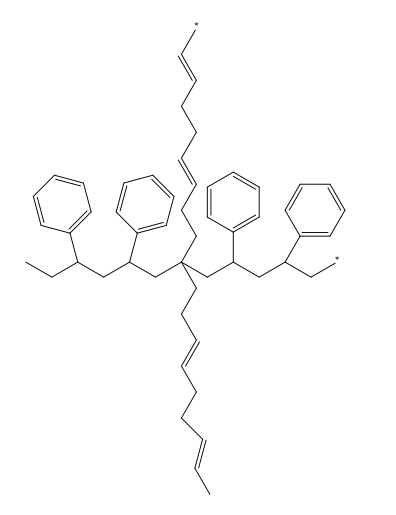
Figure 2: High Impact Polystyrene (HIPS) consists of the polystyrene backbone with polybutadiene chains branching from it in each direction.
The two polymers are functionally miscible and form a single phase alloy. The compatibility between the two polymers is due to the inherent molecular structure of the two polymers, including the presence of benzene rings in the repeat units of both chains.
This alloy combines the inherent benefits of PPO resin:
- High heat resistance
- Good electrical properties
- Excellent hydrolytic stability
- Ability to use non-halogen FR packages
with qualities of HIPS:
- Excellent dimensional stability
- Good processibility
- Low specific gravity
The poly(phenylene ether) and high impact polystyrene alloy is commercially available from a number of suppliers. The relative ratio of PPE and HIPS can be varied to tailor individual resin properties. For example, the glass transition of the alloy can range from 107 °C to 169 °C in commercially available resins. A common nominal alloy consists of 25% PPE and 75% HIPS by weight.
PPE+HIPS alloys exhibit a variety of attractive properties, including:
- Stiffness and strength
- Thermal stability
- Creep resistance
- Impact strength
- Electrical insulator
- Hydrolytic stability
- Processability and low shrinkage
This paper illustrates the functionality, molecular structure, and material properties through extensive analysis and evaluation of a common commercially available grade of PPE+HIPS resin.
Fourier Transform Infrared Spectroscopy – Spectral Correlation with Structure
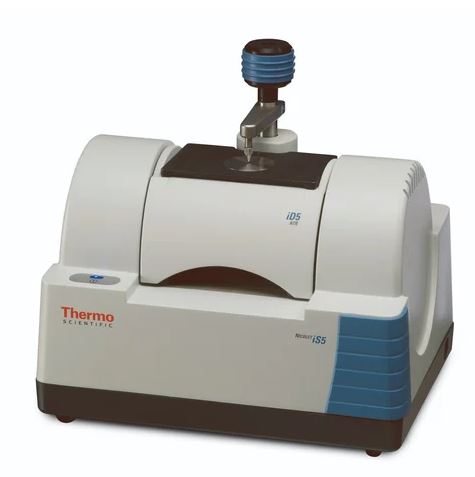
Thermo Fisher Nicolet iS5 FTIR
Fourier transform infrared spectroscopy (FTIR) provides information on the molecular structure of poly(phenylene ether) and high impact polystyrene alloy. FTIR is a fundamental tool for the compositional analysis of polymeric materials. It is a common analytical method often the first one used in the analysis of plastics. While commonly used, there can be a lack of understanding regarding the relatively simple principle behind the technique. A sample is bombarded with infrared energy. Functional groups, a specific grouping of atoms or bonds within the structure of the polymer, absorb energy at certain frequencies, commonly measured as wave numbers (cm-1), and transmit at others. The frequencies at which the material absorbs infrared energy correspond to molecular vibrations that are produced within the sample. These molecular vibrations include stretching, twisting, rocking, wagging, and scissoring. In a way, this pattern of absorption bands can be thought of as a fingerprint of the material’s molecular structure.
Reading the spectrum is a matter of determining which groups and bonds are presented by absorption bands in the spectrum. It is important to understand the molecular structure – the chemistry – of polymeric materials since it is this molecular structure that determines the properties of plastics. This is why FTIR is such an important test; it provides information about how the sample being tested is literally put together. Too many times, the interpretation of FTIR spectra ends with a library search. While that is a great place to start, there is much more that can be gleaned from the results. Detailed interpretation of the FTIR spectrum can elucidate the structure of the material being analyzed.
A sample of the poly(phenylene ether) and high impact polystyrene alloy was analyzed using a Thermo Fisher Nicolet iS5 spectrometer. The correlation between the obtained spectrum and the polymer structure is well illustrated in the color-coded graphic (Figure 3). The structure of PPE+HIPS has several functional groups, including aliphatic alkane and alkene, aromatic hydrocarbon, substituted benzene ring, and ether. The combination of these functional groups within the polymer determine the fundamental properties of the material.
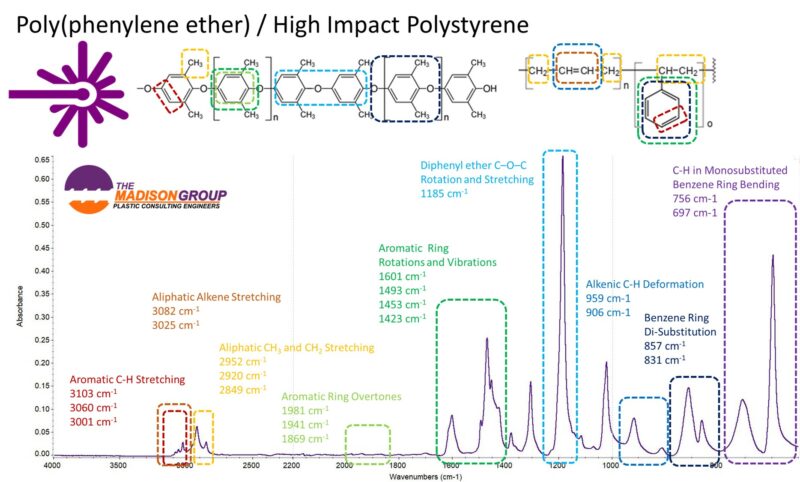
Figure 3: FTIR spectrum showing correlation of spectral features and the molecular structure of PPE+HIPS.
Thermal Analysis

TA Instruments 2500 DSC
Extending the analytical testing of the poly(phenylene ether) and high impact polystyrene alloy , thermal analysis was used to characterize the material. Thermal analysis techniques like dynamic mechanical analysis (DMA), differential scanning calorimetry (DSC), and thermogravimetric analysis (TGA) can provide valuable information about the thermal properties and behavior of PPE+HIPS. Combing the plots of these three techniques allows an assessment of the thermal transitions from -150 °C to 600 °C. These analyses were conducted using TA Instruments Discovery DMA 850, DSC 2500, and TGA 5500.
DMA can identify changes in storage modulus corresponding to a transition from a glassy state to more flexible rubbery state. In the PPE+HIPS results there are two separate such transitions, one at -100 °C associated with the polybutadiene functionality in the high impact polystyrene and another at 131 °C corresponding to the single phase alloy of poly(phenylene ether) and polystyrene.
DSC can determine the primary glass transition temperature of the alloy, which was determined as 145 °C for this particular grade of PPE+HIPS. Additionally, the DSC results illustrate the heat flow changes associated with the glass transition.
TGA can reveal the temperature range at which poly(phenylene ether) and high impact polystyrene alloy starts to degrade as an assessment of its thermal stability. The temperature at 5% weight loss, used in some cases as a measure of excessive thermal degradation resulting in loss of effective life, was identified as 406 °C. The results also provide insight into the decomposition behavior of the material as a function of temperature. For this PPE+HIPS material, a single continuous weight loss transition was observed.
While, not commonly done, plotting DMA, DSC, and TGA data on the same graph can be a useful way to visualize and compare the thermal properties and allows for a comprehensive understanding of the material’s behavior over a wide temperature range (Figure 4).
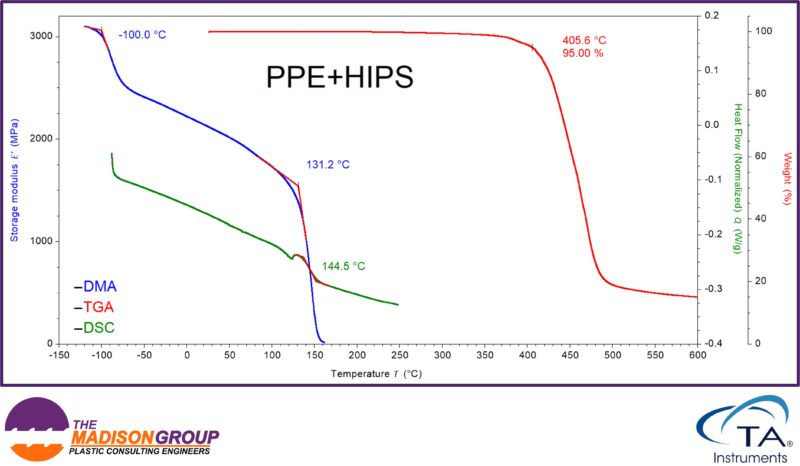
Figure 4: Combined thermogram showing the PPE+HIPS thermal properties from DSC, TGA, and DMA.
Thermogravimetric Analysis
TA Instruments TA 5500 TGA
A deeper look at the thermogravimetric analysis (TGA) results shows how they correlate with the molecular structure of the material. The TGA evaluation was conducted using the following thermal profile:
- Heat to 650 °C at 20 °C/min in N2
- Cool to 500 °C in N2
- Heat to 800 °C at 20 °C/min in Air
The TGA results show a 2-step weight loss profile (Figure 5). The initial weight loss takes place between 360 °C and 520 °C in nitrogen and represents 86% of the sample weight. This weight loss correlates to the initial thermal decomposition of the PPE and HIPS polymers under nitrogen. The second wright loss of 14% occurs under the air purge and is centered at 573 °C. This corresponds to the combustion of carbonaceous char produced during the initial polymer degradation.
Previous analysis of HIPS indicated complete thermal decomposition in nitrogen, without the formation of carbonaceous char. As such, the char produced is solely associated with the PPE. The thermal degradation of PPE is a multi-step process involving various reactions and intermediate species. Carbonaceous char is produced as part of the thermal degradation of PPE in a nitrogen atmosphere, as part of the following steps.
When PPE is heated, its polymer chains begin to break down through chain scission and other thermal cleavage reactions. This process releases volatile components and generates fragments of various sizes. Some of the smaller fragments generated during decomposition can react with each other through condensation and cross-linking reactions. These reactions can lead to the formation of larger, more stable structures that contribute to the development of a char-like residue.
The presence of aromatic rings in the PPE structure means that some of the fragments generated during decomposition are rich in carbon. As these fragments accumulate and interact, they can start forming interconnected carbonaceous networks. The carbon-rich fragments can undergo further thermal processes that involve carbonization, leading to the formation of solid carbonaceous material. This is the basis for char formation. The formation of char during the thermal degradation of PPE is the direct result of the polymer’s chemical structure, particularly the high aromatic ring content.
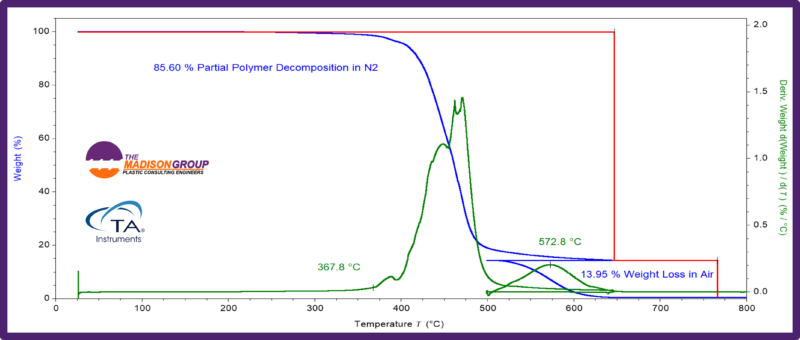
Figure 5: TGA thermogram of PPE+HIPS.
Dynamic Mechanical Analysis – Temperature Ramp
TA Instruments 850 DMA
Dynamic mechanical analysis (DMA) provides insightful information regarding the structure and mechanical properties of polymeric materials. It is a thermal analysis technique that assesses viscoelastic properties, and provides an understanding of the temperature, time, and frequency dependencies of polymeric materials. A temperature ramp was conducted on the material from -120 °C to 160 °C, and collected data included:
- The storage modulus representing the material’s ability to store elastic energy as a measure of its stiffness.
- The loss modulus reflecting the material’s ability to dissipate energy as heat. It is associated with viscous behavior and indicates the level of damping or energy loss during deformation.
- The Tan Delta shows the ratio of loss modulus to storage modulus and is associated with the material’s damping properties.
The following were elucidated from the DMA thermogram obtained on poly(phenylene ether) and high impact polystyrene alloy with increasing temperature (Figure 6).
The storage modulus showed a stepped loss of modulus with an onset of -99 °C, accompanied by a localized maximum in the loss modulus and Tan Delta at -87 °C. These responses corresponded to the glass transition within polybutadiene segments in the HIPS. A glass transition temperature of -87 °C was identified, by convention as the maximum in the loss modulus. Above that temperature, the material can be expected to be more flexible and less brittle than below.
Between -65 °C and 75 °C, the material underwent a consistent reduction in storage modulus accompanied by a stable increase in loss modulus and tan delta, as the temperature increased. This represented a temperature dependent gradual decrease in stiffness – classic behavior for an amorphous polymer below the primary glass transition.
At 120 °C, the storage modulus showed the onset of a primary transition, accompanied by localized maxima in the loss modulus at 146 °C and Tan Delta at 158 °C. These transitions were associated with the glass transition of the PPE and PS miscible phase. A glass transition temperature of 146 °C was identified. Above that temperature the material exhibited a modulus value, but had effectively lost load-bearing capability. The presence of a single glass transition indicated that the two polymers were homophasic.
DMA, as illustrated in this example, provides valuable information regarding the structure and performance properties. DMA can be beneficial in material selection and product design, as well as part of failure analysis and other troubleshooting activities.
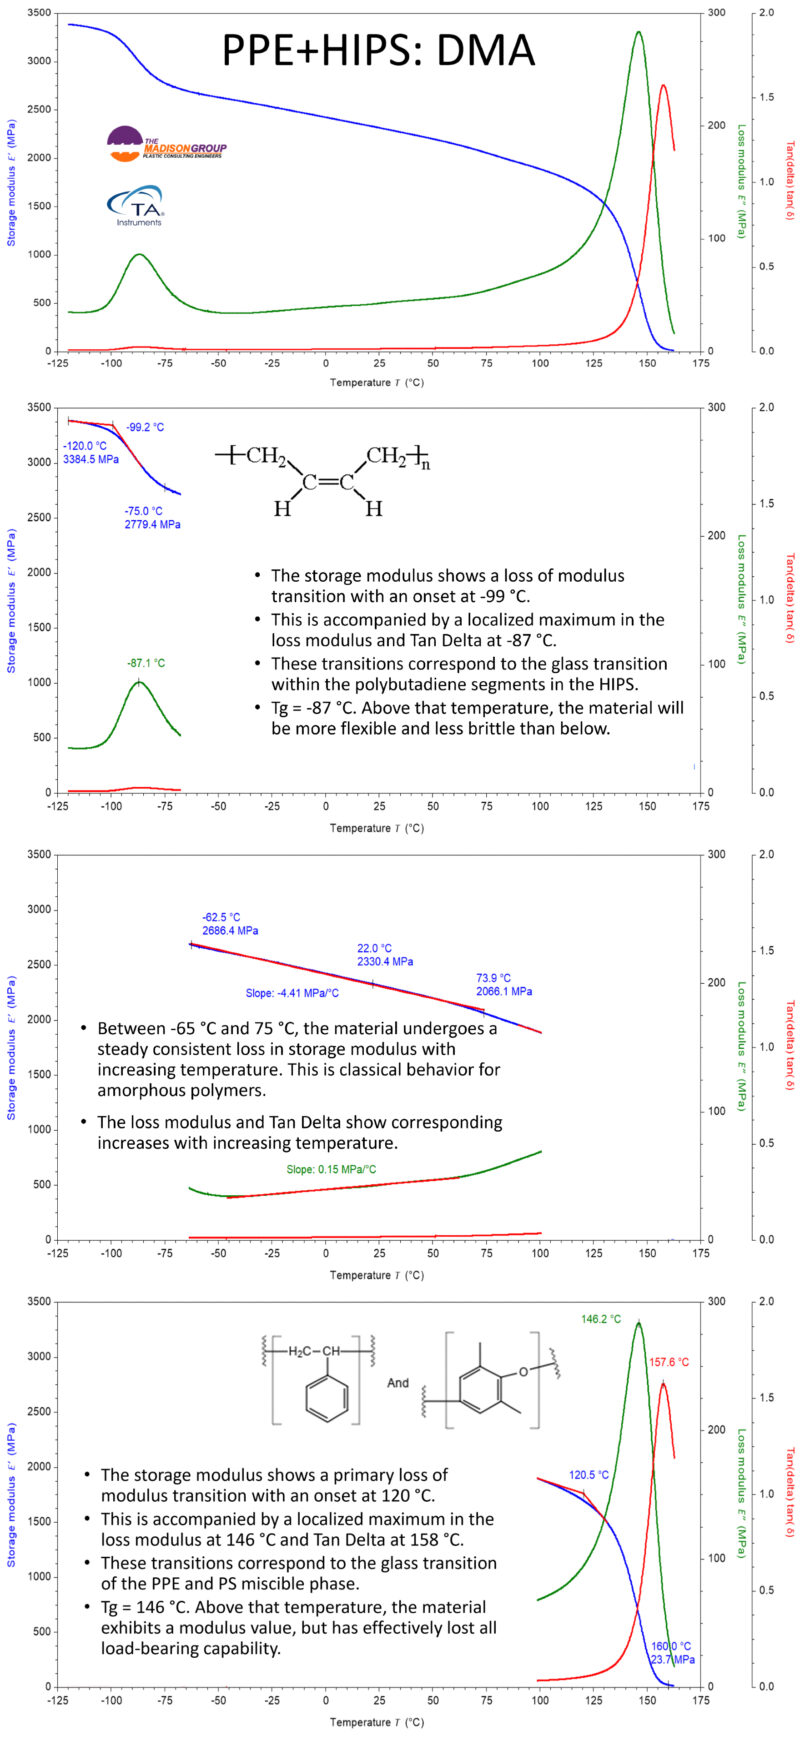
Figure 6: DMA profile showing the temperature ramp of PPE+HIPS.
Tensile Testing and Knit Line Strength
Tensile testing was performed on specimens injection molded using a tool with a single end gate. The testing was performed per ASTM D638 at ambient laboratory conditions using an MTS mechanical tester. The results demonstrated behavior classical for an amorphous resin, including sequential changes within the molecular structure (Figure 7):
- Linear Elastic Deformation: Material deforms through linear and reversible behavior.
- Non-linear Elastic Deformation: Material deforms nonlinearly, but still in reversible manner.
- Yielding: Transition from elastic to plastic deformation taking the material past reversibility. Tensile strength at yield.
- Plastic Deformation: Material continues to deform with no or small increase in stress.
- Necking: Material undergoes a localized reduction in cross-sectional area, leading to non-uniform deformation.
- Ultimate Failure: The material reaches a point where it can no longer withstand the applied stress, and ruptures.
The obtained results were consistent with the data on the material data sheet, including modulus, tensile strength at yield, elongation at yield, and elongation at break.
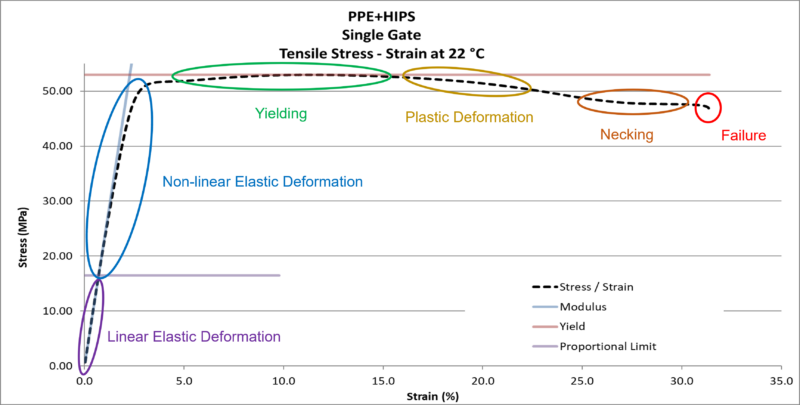
Figure 7: Stress/strain data from tensile testing the PPE+HIPS.
Testing was also performed on specimens injection molded using a dual gate configuration, resulting in a knit line in the midsection of the tensile bar. A knit line is a location on a part where two flow fronts of molten plastic meet and fuse during the molding process. If the two mating flow fronts are poorly fused – relatively poorly entangled on a molecular level – this can be a relatively weak location on the molded part.
The testing showed the dual gate specimens had a modulus that was similar to the single gated specimens (Figure 8). The stress / strain curves of the two sample sets were nearly identical through the linear elastic and most of the non-linear elastic stages, although, a 16% reduction in tensile strength was observed. Most notably, the elongation at break was reduced from 32.5% for the single gate to 2.3% for the dual gate specimens. These results clearly showed the primary effect of the knit line was the localized embrittlement of the material due to poor molecular entanglement. Fracture occurs within plastic materials as disentanglement, and the knit line severely compromised the level of entanglement.
This is an excellent example that the mechanical properties indicated on material data sheets are determined under ideal conditions, and do not represent the actual properties of molded parts. It is important to understand the true properties of formed parts in order to avoid premature failure.
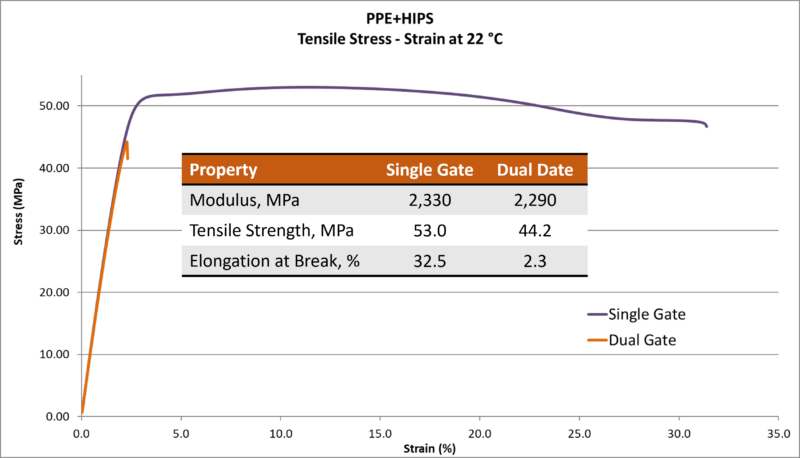
Figure 8: Stress/strain comparison of tensile specimens produced with and without a knit line.
Fatigue Strength
Understanding the fatigue properties is critical across many plastic component applications, such as:
- Gears
- Fan Blades
- Switches
- Springs and Clips
- Fasteners and Connectors
- Hinges and Latches
- Handles and Levers
- Pulleys and Rollers
- Seals and Gaskets
- Bearings and Bushings:
- Valves
- Pipes and Pressure Vessels
Any component subject to cyclic, periodic, fluctuating, or vibrational loading; or thermocycling, is subject to fatigue.
The PPE+PS material had been evaluated to characterize its tensile properties, showing that the material has a tensile strength of 53 MPa. However, tensile strength and fatigue strength are very different for all materials, especially plastics.
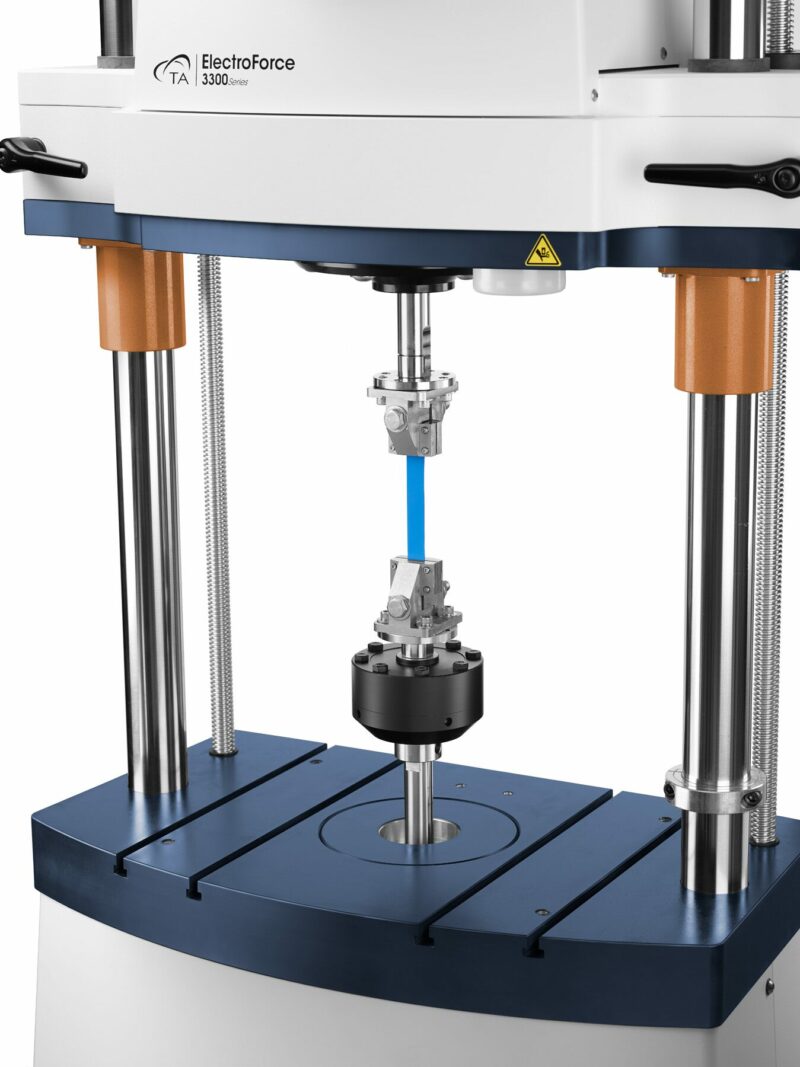
TA Instruments EelectroForce 3300 Mechanical Test System
Fatigue testing was conducted on the PPE+HIPS samples by the experienced team at TA Instruments. The testing was performed on single-gated tensile bar specimens on an ElectroForce 3330 Series III fatigue tester at 22 °C. A frequency of 5 Hz was used, and the specimens were tested using a tension – tension program, R=0.1 in stress (force) control. Compressed air was blown on the samples to prevent material temperature change due to internal heating.
The results of fatigue testing are graphically represented as an SN curve, also known as a fatigue curve or a Wöhler curve. It illustrates the relationship between cyclic stress amplitude (S) and the number of cycles to failure (N) for a given material under fatigue loading conditions. The SN curve is a fundamental tool used in fatigue analysis and is crucial for understanding the fatigue behavior and life expectancy of materials. The testing produced an SN curve for the PPE+HIPS material (Figure 9).
The fatigue strength of the poly(phenylene ether) and high impact polystyrene alloy is lower than its tensile strength (Figure 10). Tensile strength represents the maximum stress a material can endure through a slowly applied load. On the other hand, fatigue strength refers to the maximum stress a material can endure for a given number of cycles before fatigue failure occurs. Fatigue failure happens due to the accumulation of damage to the polymer molecular structure over repeated cycles of stress – stress often well below the tensile strength of the material.
An SN curve is used as a fundamental tool to prevent premature and unexpected failure in plastic components. It provides critical information that helps engineers and designers make informed decisions regarding material selection, and component design and specification to ensure the longevity and reliability of components. This is an excellent example of testing that is typically not available from resin supplier but is essential to help make material and design decisions to avoid failure.
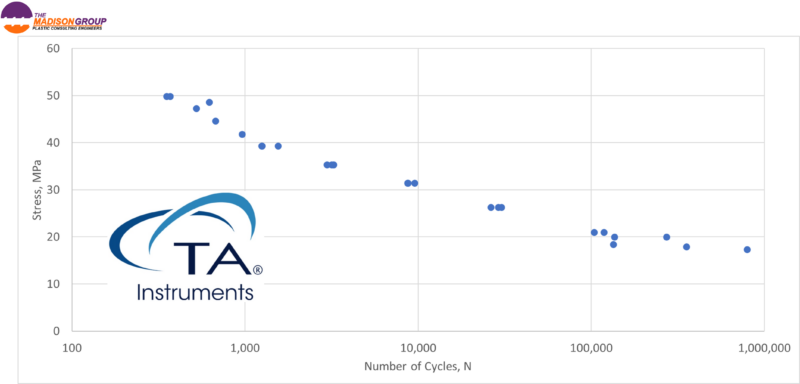
Figure 9: SN curve representing the fatigue performance of PPE+HIPS.
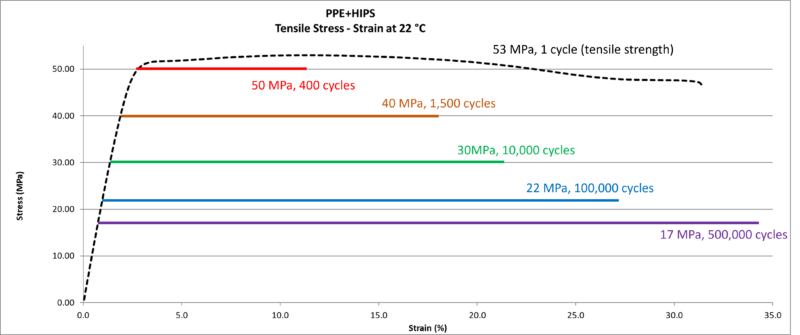
Figure 10: Graphic comparison of the tensile and fatigue strength of the PPE+HIPS.
Additional fatigue testing was performed on bars molded in a tool using a dual gate configuration, resulting in a knit line in the midsection of the bar. This testing was also conducted by the experienced team at TA Instruments. This fatigue work mirrored the comparative tensile testing performed on the material. The results of the tensile testing had showed that the dual gate specimens had a modulus that was similar to the single gated specimens, and only a 16% reduction in tensile strength. The biggest difference was demonstrated in the elongation at break, reduced from 32.5% for the single gate to 2.3% for the dual gate specimens.
The fatigue data showed a much greater difference in performance between the single gate and dual gate specimens (Figure 11). While the SN curve for the dual gate results paralleled that representing the single gate samples, there was a distinct offset. For example, the application of a cyclic stress of 20 MPa on the single gate bars resulted in failure at approximately 200,000 cycles, but only 10,000 cycles for the dual gate bars. Looking at the data alternatively, the stress associated with a lifetime of 350,000 cycles was approximately 18 MPa for the single gate bars, but only 9 MPa for the dual gate bars.
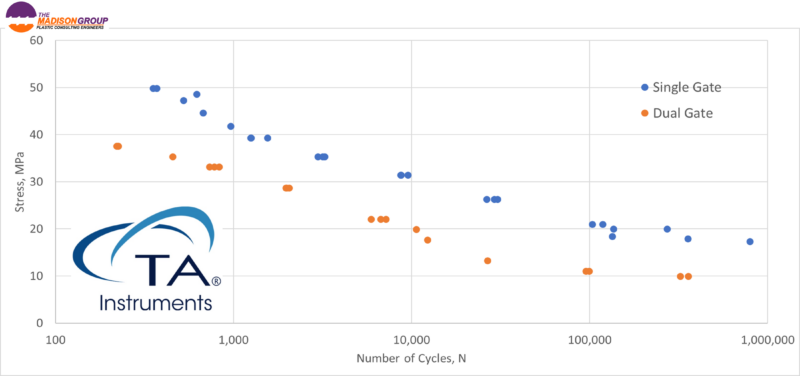
Figure 11: SN curve comparing the fatigue performance of PPE+HIPS samples with and without a knit line.
This level of performance loss was not predicted by the tensile testing. This is clearly another example where short-term testing cannot predict the long-term performance of plastics, demonstrating that in-depth material testing is often required to avoid field failures.
The knit line produced using the dual gate molding configuration reduced the fatigue life of the poly(phenylene ether) and high impact polystyrene alloy resin in a way not anticipated based on the tensile test data. The application of dynamic stress loading in conjunction with the poor fusion associated with the dual gate specimen knit line, resulted in poor fatigue performance. Knit lines are present on most injection molded plastic parts and are locations where two flow fronts of molten plastic meet during the molding process. If the two mating flow fronts are poorly fused – relatively poorly entangled on a molecular level – this can be a relatively weak location on the molded part, as the fatigue testing demonstrated.
Dynamic Mechanical Analysis – Frequency Sweep
Most often, when considering DMA, thoughts go to a temperature ramp, which assesses the modulus of the material over a temperature range. However, since DMA assesses the viscoelastic properties of materials, it can be used to evaluate plastic materials for temperature, time, and frequency dependent properties. A DMA frequency sweep varies the frequency of applied stress on a material sample while measuring storage modulus, loss modulus, and tan Delta. The purpose of a frequency sweep is to investigate how a material’s viscoelastic properties change in response to different frequencies of stress. Different materials respond in unique ways to dynamic loading at varying frequencies. The frequency sweep helps in understanding how the material’s stiffness (storage modulus), damping properties (loss modulus), and energy dissipation (tan Delta) change with frequency. This can be very help as part of assessing the performance under conditions of dynamic stress loading, such as fatigue.
Many plastics applications involve materials subjected to dynamic loading across a range of frequencies, including automotive components, electronic devices, medical articles, sports and recreation equipment, and structural elements. The fatigue life and durability of materials can be affected by the loading frequency. In order to select the proper material, it is important to understand how prospective materials perform. The choice of material for a specific dynamic application often depends on the expected operating frequencies. Understanding the material’s response through a frequency sweep helps in predicting its fatigue behavior and ensuring its durability in long-term applications.
A frequency sweep was conducted at 22 °C from 1 Hz to 200 Hz using A TA Instruments DMA 850. The resulting thermogram showed a steady rise in storage modulus with increasing frequency through 100 Hz (Figure 12). Above that, there was an inflection. The loss modulus demonstrated a slight decrease, with a localized peak corresponding to the storage modulus. Inflection.
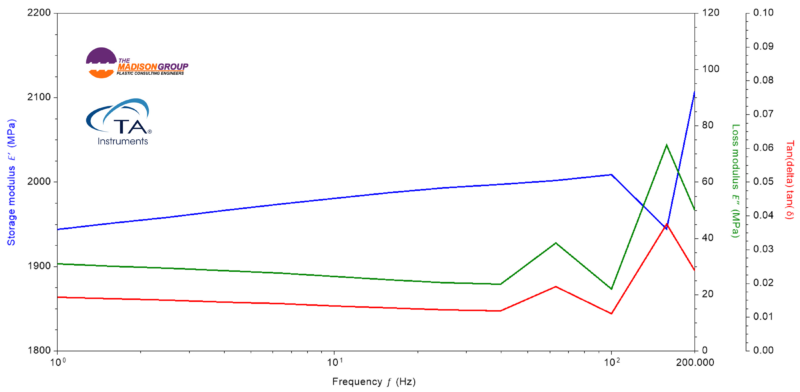
Figure 12: DMA frequency sweep thermogram obtained on the PPE+HIPS.
Fractographic Examination
Fractography is an important part of a failure analysis, and different plastics will exhibit varying features under divergent loading conditions. Studying laboratory failures is a good way to understand how a particular plastic responds in regard to fracture surface features. The condition of the samples is also important to the observed features. The samples produced with and without knitlines were studied.
The elongation at break was reduced from 32.5% for the single gate to 2.3% for the dual gate specimens, clearly showing the effect of the knit line was the localized embrittlement of the material due to poor molecular entanglement. Fracture occurs as disentanglement within plastics, and the knit line severely compromised the entanglement. The macro examination of the tested tensile bars provided visible corroboration of the tensile data. The single gate specimens were visually stress whitened and had undergone yielding, matching the stress/strain data (Figure 13). The dual gate specimens showed no signs of elongation and exhibited features characteristic of brittle fracture. The failure location corresponded to the knit line location.
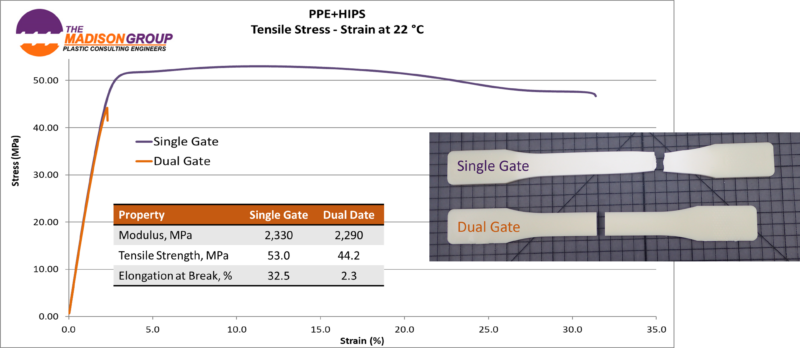
Figure 13: Macro views showing the variation in the tested tensile bars with and without a knit line.
Microscopic examination of untested bars revealed a distinct knit line where the mating flow fronts merged, but did not adequately fuse (Figure 14).
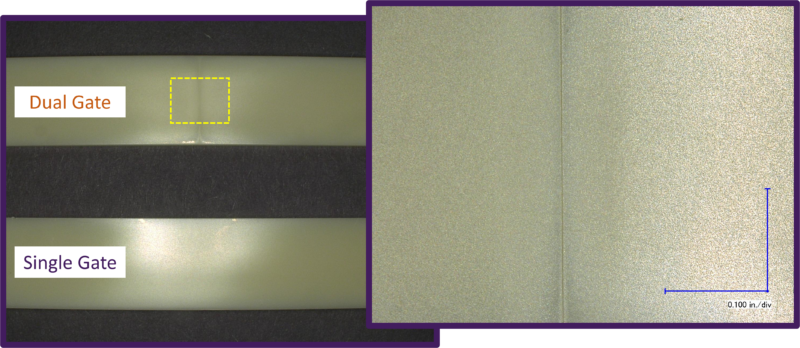
Figure 14: Photomicrographs showing the samples with and without a knit line.
The examination of the single gate fracture surface using a Keyence digital microscope and Tescan Vega scanning electron microscope (SEM) showed a high level of macro ductility through 50X (Figure 15). The crack surface displayed gross plastic deformation. The dual gate specimens showed a flat profile without stretching.
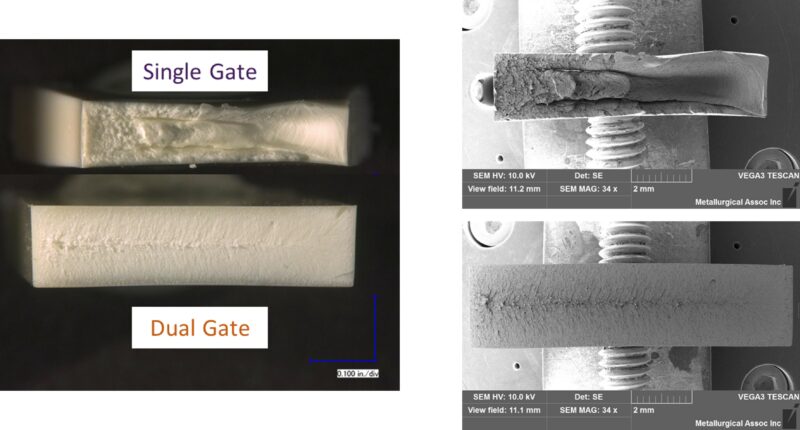
Figure 15: Photomicrographs and scanning electron images showing and compared tensile test fracture surface of specimens with and with out knit lines.
Distinct crack origin locations were identified on both specimens along the outer edge of the tensile bar, a point of stress concentration (Figure 16). At high magnification, over 500X in the SEM, the single gate specimen showed features characteristic of a moderate level of micro ductility. The dual gate specimen displayed relatively high micro ductility in the form of localized stretched flaps.
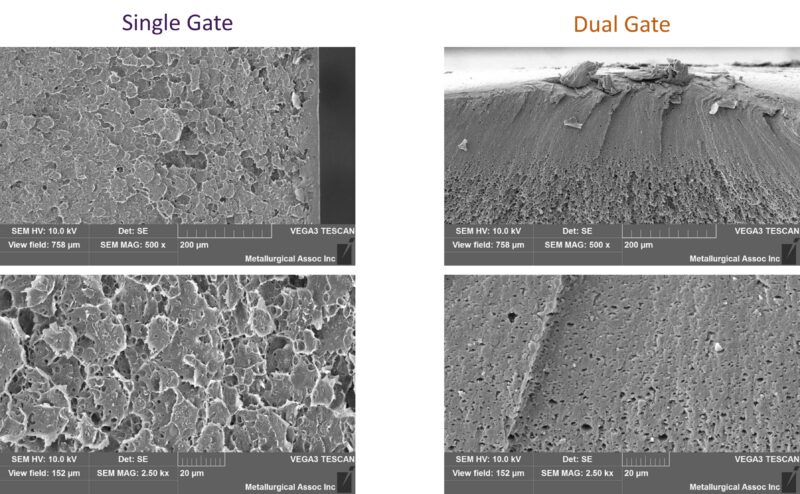
Figure 16: Scanning electron images showing crack origins locations on the tensile specimens with and without knit lines.
The comparative micro features seem counterintuitive at first, with the knit line samples showing greater micro ductility. However, there are explanations for the observed micro ductility on the otherwise brittle specimen. The presence of a knit line introduces a discontinuity in the material’s structure, which can lead to stress concentration and the initiation of microcracks at the knit line during the tensile test. While the macro ductility is reduced on the dual gate specimen, the microstructure near the knit line may undergo localized plastic deformation due to microcracking, creating the appearance of a high level of micro ductility. The knit line can also cause strain localization during deformation, resulting in micro ductility.
Conclusion
Poly(phenylene ether) and high impact polystyrene (PPE+HIPS) is a very versatile plastic, and is used in a wide variety of applications, including:
- Electronics Enclosures
- Water Handling Components
- Automotive Components
- Consumer Goods
- Medical Equipment
- Telecommunication Devices
- Power Tools and Equipment
- Industrial Equipment
- Construction Materials
- Lighting Fixtures
This alloy combines the inherent benefits of PPO resin with qualities of HIPS. The versatility of this resin is enhanced because the relative ratio of PPE and HIPS can be varied to tailor individual resin properties.
To learn more about the history and development of PPE, check out these two articles written by Michael Sepe, as written for Plastics Technology Magazine:
https://www.ptonline.com/articles/tracing-the-history-of-polymeric-materials-part-22
https://www.ptonline.com/articles/tracing-the-history-of-polymeric-materials-part-23