Today, the plastics industry is utilizing fiber reinforcements to create composite materials that are lighter and stronger. Some of the most common types of fiber reinforcements utilized for composite materials are glass and carbon fibers. By combining reinforcements, such as glass fibers or carbon fibers, to the polymer, the material can be modified to match the specific properties required for the application. For example, reinforcements such as glass fibers will improve the strength and stiffness, while providing a benefit of being lightweight. Although this article will focus on how glass fiber lengths can affect the part properties, the information is valid across other fiber reinforced composites.
When a load is applied to the composite material, the weaker polymer structure will transfer the loading to the fiber reinforcement. To completely transfer the loading from the polymer to the fibers, an adequate fiber length must be maintained. This value is referred to as the critical fiber length, which is dependent on the adhesion between the polymer and glass fiber. For a perfect adhesion case, the critical fiber length can be calculated as.
Lc = D x [σf/(2 x τm )]
In this article, we will focus on long fiber filled polypropylene. Assuming 17 micron fiber with a tensile strength of 2000 MPa and a shear strength of 39.37 MPa for polypropylene, the perfect fiber adhesion case will result in a critical fiber length of 0.432 mm. However, polypropylene does not readily adhere to glass fibers, Figure 1.
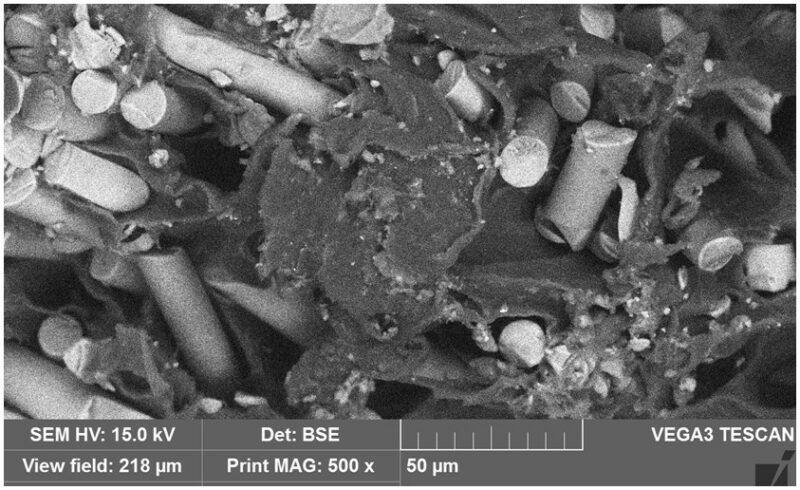
Figure 1: View showing poor fiber adhesion.
Therefore, critical fiber length values for polypropylene for uncoupled polypropylene can range from 1 to 3 mm in length. This length is 300% to 700% higher than the perfect adhesion case. To promote adhesion between the polymer and glass fibers, a coupling agent is added to the composite material, Figure 2.
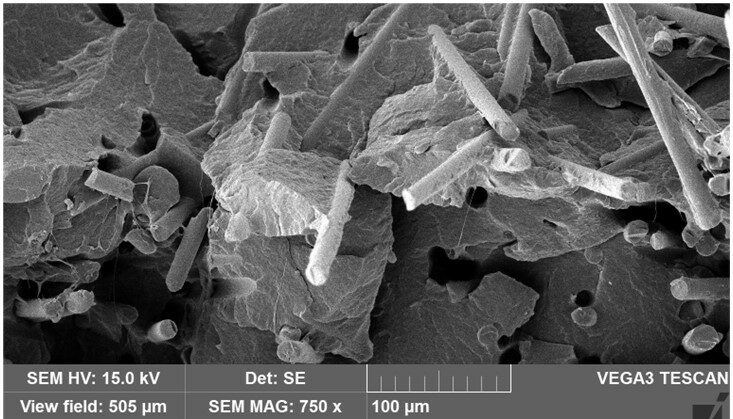
Figure 2: View showing chemically coupled PP.
When adding reinforcements such as glass fibers to the polymer, there are different sizes of fibers that can be utilized. A broad categorization of fiber lengths is short glass fiber and long glass fiber. Short glass fiber materials typically start with fiber lengths less than 1.0 mm, while long glass fiber filled composites start with a glass fiber length above 10.0 mm. During compounding and processing of the material, the fiber length will get reduced due to the expected manufacturing conditions. The more aggressive the compounding and processing conditions are, the higher the fiber attrition will be. Although guidelines may be followed during processing of the material, screw geometry will have a significant influence on the amount of fiber attrition. Specifically, in our case, the use of a general purpose screw result in a 15% reduction in short glass fiber lengths. In long fiber filled materials, the fiber length was reduced by 95%.During the following study, material testing was performed to evaluate the influence of glass fiber length on the mechanical properties of the composite material. The initial fiber length of the long glass fiber polypropylene was 11 mm. While using recommended conditions for injection unit parameters, the fiber attrition during screw recovery resulted in an average fiber length of 1.386 mm. As a substantial degree of fiber breakage during screw recovery, back pressure and screw rpm were varied to study the influence. This resulted in average glass fiber lengths ranging from 1.386 mm to 0.879 mm with varying back pressure and average glass fiber lengths ranging from 1.155 mm to 0.879 mm with varying screw rpm. These are only a few parameters that can have an influence over glass fiber breakage. Other influences during processing include mold temperature, melt temperature, injection speed, and hold pressure. However, processing is not the only influence on the amount of fiber breakage. Part design can have a significant influence over fiber attrition, which includes runner geometry and size, gate geometry and size, wall thickness, corners and overall geometry.
In today’s industry, short-term testing, such as a tensile pull, is performed to evaluate the strength of a composite material. As shown in Figure 3, a 6% change in tensile properties is observed with fiber lengths of 1.386 mm and 0.879 mm.
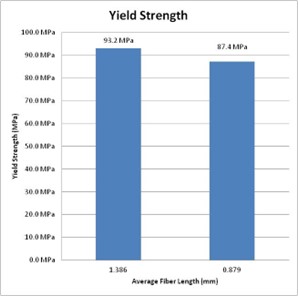
Figure 3: Yield strength data.
Although there was a small shift in the tensile data, it is unknown how the long-term properties of the composite material will be effected. Therefore, assessment of the creep properties was conducted via dynamic mechanical analysis (DMA). The DMA was utilized using the time temperature superposition principle to generate a master curve. For this article, a life expectancy determination will be completed for a 30 MPa service load placed on the material. Based on measured tensile data shown in Figure 3, this would result in a 291% to 311% safety factor compared to the yield strength of the material.
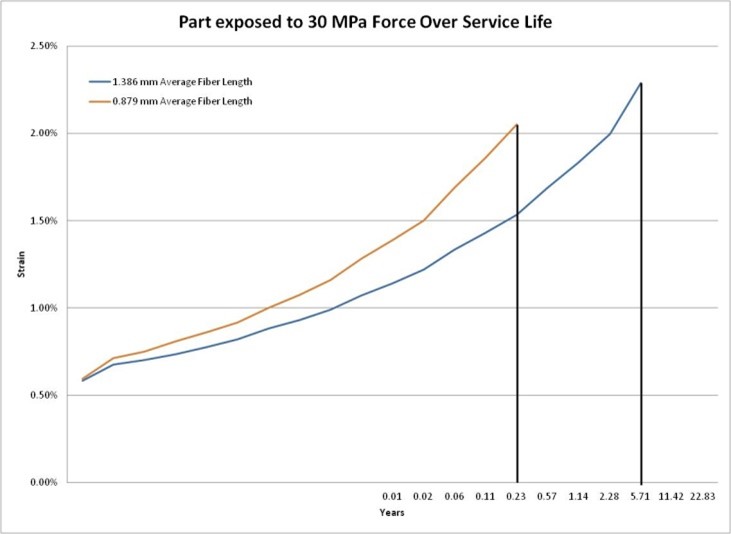
Figure 4: Long-term data.
The long-term life expectancy of the part exposed to 30 MPa is shown in Figure 4. The data showed that an average fiber length change from 1.386 mm to 0.879 mm resulted in the 96% drop in the life expectancy. This is a dramatic shift in properties. Therefore, an important aspect when utilizing glass filled materials, is determining how glass fiber lengths will influence the long-term properties and measure the glass fiber length.
As previously noted, the goal of the composite material is to transfer the loading from the weaker polymer structure to the glass fibers. As shown above, the degree of loading transferred is dependent on the length of the glass fibers. Therefore, knowing the glass fiber length distribution is an extremely important aspect to predicting part performance. There are multiple ways to characterize the fiber length of the material. These techniques can range from manual measurement to using automated image-processing algorithms. To gain an understanding into the measurement techniques, a background into the measuring processes will be reviewed. For most techniques, the initial task is separating the glass fibers from the polymer. The method typically utilized for the separation is heating the material in an oven. During heating of the material, the polymer will undergo thermal decomposition, leaving behind the higher temperature resistant glass fibers. However, if too high of temperature is utilized, the fibers can undergo a softening process that will hinder fiber measurement. This could mean that some high temperature resistant polymers, may require alternative separation techniques. Furthermore, dependent on the material, other inorganic or high temperature resistant fillers/additives could be present within the incombustible material and restrict measurement.
Upon separation of the glass fibers, the fiber will require a dispersion technique to allow for a measurement process to be utilized. There are multiple ways this can be performed such as manual, solution and/or funnel dispersion of the fibers. With the completion of the dispersion phase, the fibers are ready to be measured using the desired technique.
Manual measurement of the fibers through a digital image is the most simplistic of the techniques. However, this technique will often result in capturing the longer fibers, with minimal measurements of the short fibers. This will result in a higher than expected average fiber measurement. Furthermore, this measurement technique is dependent on the individual completing the technique, which can result in variability between sample to sample.
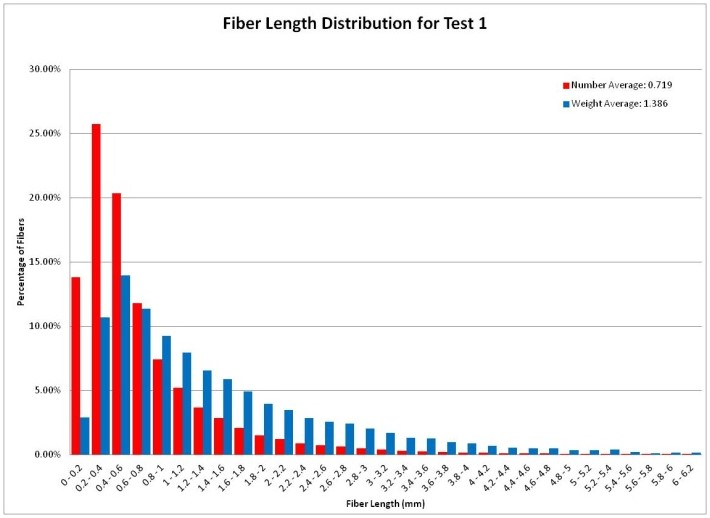
Figure 5: View of a fiber length distribution chart.
Another method that can be utilized is using automated image-processing algorithms to characterize the glass fiber length distribution. The algorithms will result in the measurement of each glass fiber down to the threshold distance set by the user. Furthermore, the algorithms will distinguish between multiple fibers that cross over each other and the curvature of the glass fiber. Although this is a more advance method, measuring the same fiber dispersion twice resulted in zero difference. Furthermore, it results offer a complete representation of the fiber lengths through a fiber length distribution chart, Figure 5.
Whatever measurement technique is utilized, it is important to know what the fiber length distribution is and how changes in length will affect the properties of the composite material.
This paper was originally authored by Dayton S. Ramirez.