Introduction
In Part 1 of this article series, I discussed what Modulated DSC (MDSC) is and how you can separate different competing transitions in a polymeric sample by applying an average steady heating rate with sinusoidal modulations. This second installment dives into what a typical modulated DSC curve looks like, and what type of information can be gathered from the different variables/signals collected during testing. A cast poly(methyl methacrylate) (PMMA) that is used to form seams in large aquariums was used for testing. The PMMA was heated from 0 °C to 250 °C at 1.0 °C/min with a modulation of 1.0 °C every 60 seconds (First Heat). The material was cooled back down to 0 °C and reheated to 250 °C at 1.0 °C/min with a modulation of 1.0 °C every 60 seconds (Second Heat). (For assistance with modulation conditions for modulated DSC, there is a series of technical articles by TA Instruments on MDSC that are helpful.)
Heat Flow (Normalized)
Heat flow to or from the sample is collected and plotted on the y-axis with the temperature plotted on the x-axis (Certain types of experiments might plot time on the x-axis). This signal shows how the material reacts to the average heat flow, and is representative of what you would get from a standard DSC experiment. Endothermic transitions (valleys), exothermic transitions (peaks), and step changes in the baseline (up/down) can all occur that are associated with changes to the amorphous or crystalline structure. For instance, an endothermic transition during heating could be associated with melting, an exothermic transition during heating might be associated with cold crystallization or curing, and a downward step change during heating could be associated with the glass transition temperature (Tg) for the material. In Figure 1, the total amount of heat flow is shown for the First Heat as compared to the Second Heat. If we had only run a standard DSC, we would not be able to separate the exothermic transition that occurred through Tg for this PMMA material as noted. Additionally, we can also better isolate the endothermic transition after Tg.
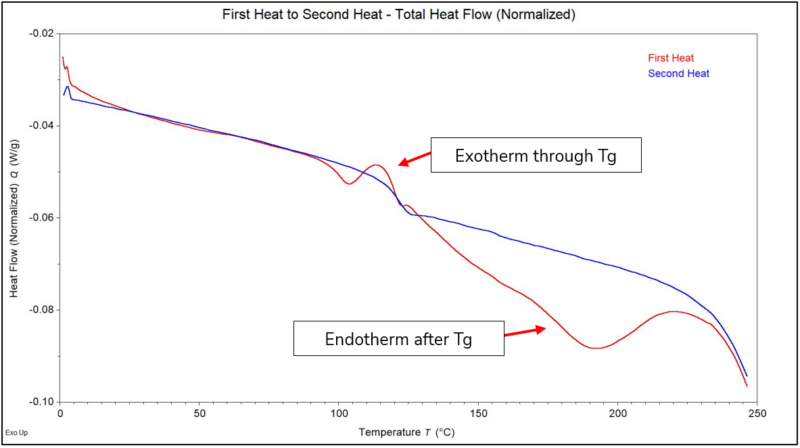
Figure 1 – Heat Flow Normalized (First Heat in Red and Second Heat in Blue)
Modulated Heat Flow (Normalized)
Modulated heat flow shows how the heat flow changes in relation to the modulations in the heating rate during the temperature ramp. This is a good variable to use when deciding if the conditions you chose were suitable for the transition(s) of interest. As shown in Figure 2, the Modulated Heat Flow is plotted and compared to the Heat Flow. In this case there are roughly 15 modulations through the stacked exotherm and Tg in the First Heat that we want to analyze. Therefore, we have plenty of modulations to ensure that our data is good. If you do not have enough modulations through the transition of interest (approximately five or more) there can be a large skew in your data. Enthalpies can be significantly increased or decreased, and there can be shifting in the temperatures of the transitions.
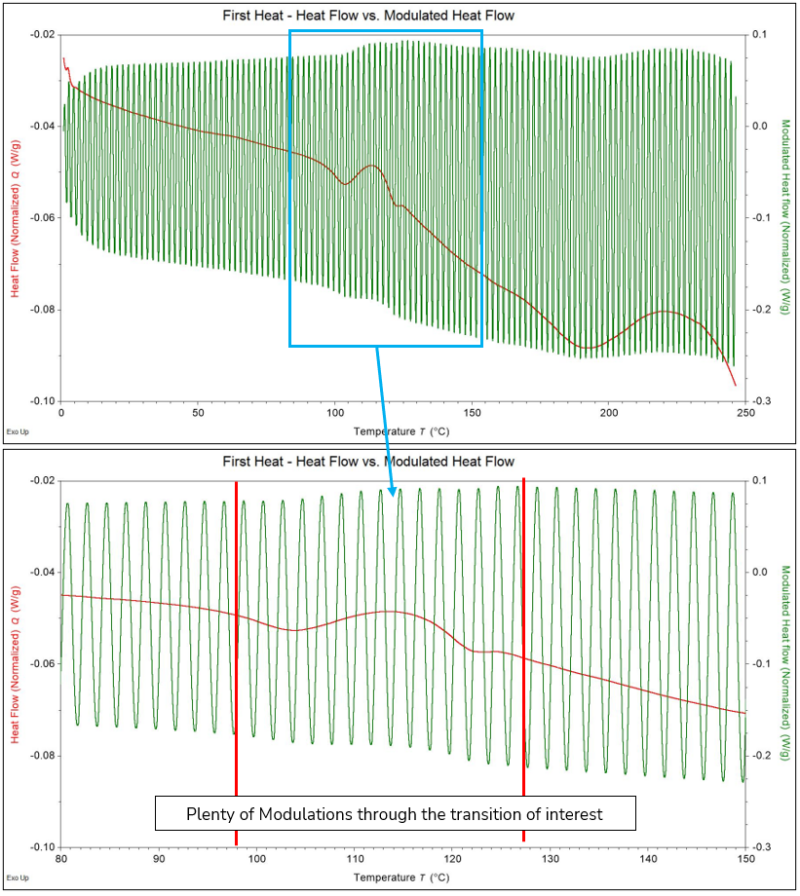
Figure 2 – Modulated Heat Flow Normalized for the First Heat over the entire temperature range (top) and zoomed into the transition of interest (bottom).
Reversing Heat Flow (Normalized)
The Reversing Heat Flow contains transitions in the material that can be “reversed” by cooling the material back down after heating. Some transitions that would be separated into this signal are melting of the polymer, glass transitions, and melting of additives. Figure 3 shows the Reversing Heat Flow for both the First Heat and Second Heat. As observed, we can fully separate the two Tg’s for the First Heat from the exothermic transition that occurred through the same temperature range. The Second Heat in comparison only shows a single Tg. This indicated that there was some amount of fully cured material in the sample (higher Tg), and the lower Tg represents partially cured PMMA.
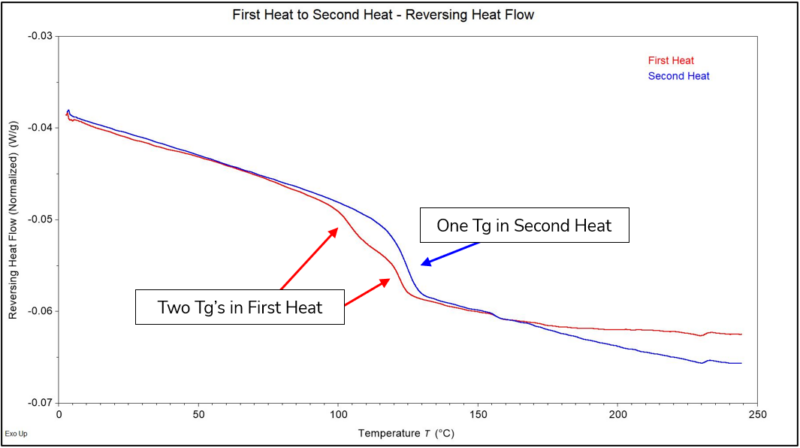
Figure 3 – Reversing Heat Flow Normalized for the First Heat and Second Heat.
Non-Reversing Heat Flow (Normalized)
The Non-Reversing Heat Flow is the signal that contains the types of structural changes in a material that would not occur by simply cooling it down back through the same temperature ranges. Some types of non-reversible phenomena that can be detected are cold crystallization, curing/polymerization, enthalpic relaxation, enthalpic recovery, and evaporation. Figure 4 shows the Non-Reversing Heat Flow for the First Heat and Second Heat. As observed, the exothermic transition through Tg and the large endothermic transition from approximately 125 °C to 225 °C are only observed in the First Heat. The exotherm was associated with curing/polymerization of the PMMA, and the large endotherm was associated most likely with evaporation of a volatile substance from the material above its Tg. In the Second Heat, the small endothermic transition that occurred through Tg is associated with the minimum amount of enthalpic recovery you would expect from a non-aged sample. If an aged sample was tested to compare, it would likely show a significantly larger endotherm through Tg representing the amount of enthalpic relaxation that has occurred in the sample through relaxation of the chains.
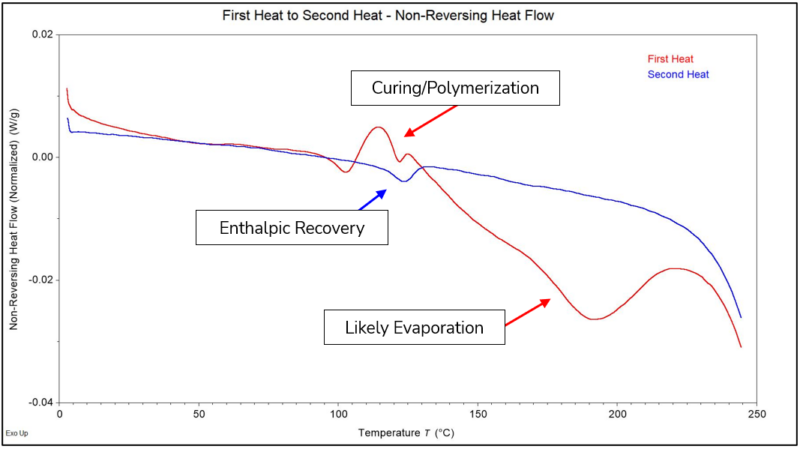
Figure 4 – Non-Reversing Heat Flow Normalized for the First Heat and Second Heat
Putting It All Together
Putting this all together, Figure 5 shows calculations that can be made for the various transitions in the First Heat and Second Heat. We would be able to understand a basic level of what is occurring in the material during the First Heating with standard DSC (curing and evaporation). However, only with modulated DSC were we able to fully separate those transitions in the First Heat and see the exact extent of partial curing on the PMMA. This produced reliable and repeatable calculations that could be made between different lots/parts. Overall, MDSC provided a much more informed view than standard DSC for this project. That is why the power of modulated DSC is invaluable for certain plastic materials for quality control, failure analysis investigations, material research, and many other applications.
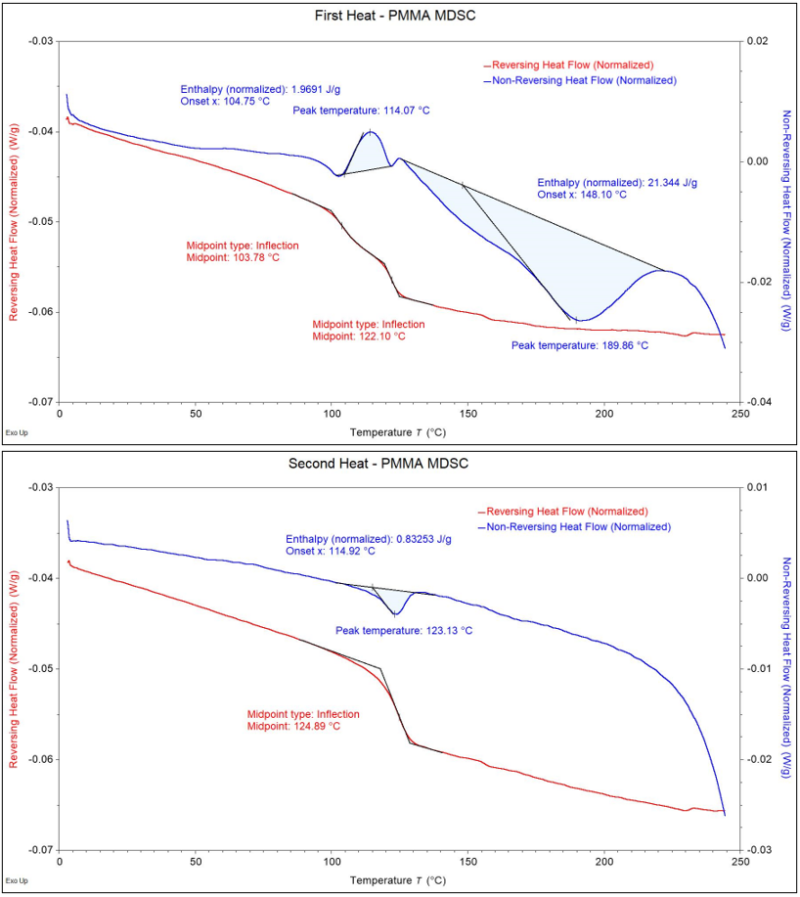
Figure 5 – Calculations on the Reversing and Non-Reversing Heat Flows from the First Heat (top) and the Second Heat (bottom).