Whenever polyurethane materials are discussed they tend to be categorized in terms of their hardness. Like most other elastomers, that hardness is typically expressed in terms of the Shore A scale for softer materials and Shore D for harder grades. While useful in describing the relative “feel” of the finished product, hardness is only the tip of the iceberg in terms of the underlying properties and complex behavior of a polyurethane.
Unfortunately, some end-users still attempt to correlate the hardness of a polyurethane to other properties such as flexural modulus, tensile strength, or tear resistance. While hardness and modulus may both reflect how the product feels to the touch, the two properties measure very different material behaviors. Therefore, an attempt to infer a polyurethane’s strength from its hardness would be misleading and incomplete.
For plastics and rubbers, the standard test method for Durometer Hardness is governed by ASTM D2240. This hardness test measures the penetration of a precision indenter into the material under the conditions of force and time. The specimen is first placed on a hard and flat surface and the indenter is pressed perpendicularly into the sample. A calibrated digital or dial gage displays the hardness value that is read within one second of firm contact with the specimen.
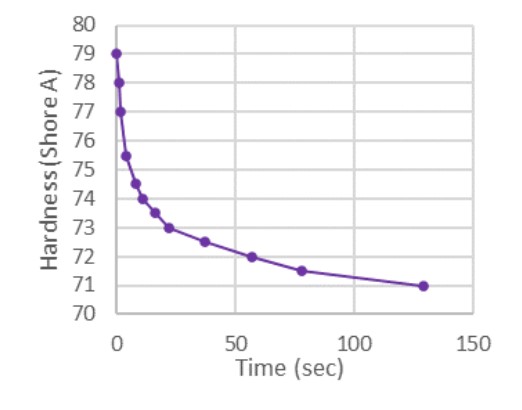
Hardness test data for a TPU.
The specifics of ASTM D2240 also permit different time durations to be used (based on customer specifications) for the hardness test. For this reason, many polyurethane material suppliers will specify a hardness value at 10-15 seconds for their materials. However, this brings up an interesting point in that a polyurethane hardness is not a fixed material property but will vary over time. For example, the measured hardness for the thermoplastic polyurethane (TPU) material shown to the left appears to “soften” depending on how long the hardness test indenter has been applied. The instantaneous initial hardness reading is 79 Shore A, but after only 2 minutes the hardness has apparently dropped by 10% to 71 Shore A. Clearly, hardness is not a fixed property of the material but a time-dependent single-point data reference that depends on the underlying chemistry as well as the viscoelastic nature of the polyurethane molecule itself.
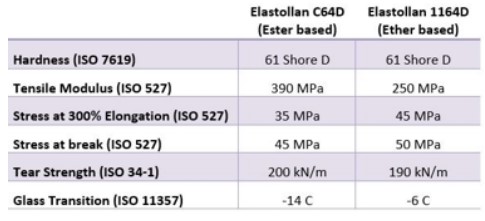
Comparison of properties for an ester- and ether-based TPU.
For example, consider the two thermoplastic polyurethane (TPU) Elastollan grades from BASF in the table to the right. Both materials are listed at identical hardness values of 61 Shore D (15 seconds), yet their mechanical properties are distinctly different. The ester-based TPU exhibits a substantially higher tensile modulus than the ether-based grade. Since it is the flexible soft block segment of the molecule that contains the (ester/ether) polyol chemistry, it should come as no surprise that the “bulkier” ester-based linkage would exhibit a stiffer (with lower elongation) initial response for tensile testing. Yet, an interesting effect can be seen when comparing the full stress strain curves for the two Elastollan materials in the figure to the left. While the ester-based material exhibits a stiffer initial response than the ether-based grade, at approximately 100% strain those responses reverse. Therefore, a prudent designer will look beyond hardness to other key properties when considering a polyurethane during the material selection process for a new product. For instance, an ether-based TPU would be preferable for a hot and humid environment where hydrolysis resistance would be needed. Conversely, an ester-based TPU will generally provide superior wear resistance and better resistance to oils, fuels and solvents. Though hardness can be useful for initial screening purposes, one must ultimately consider the effects of time, temperature, loads and environment of the intended application.
The time-dependent “softening” effect shown previously in the hardness test also reveals something about the underlying viscoelastic properties of the polyurethane molecule. Though most engineers tend to have a solid understanding of elastic properties, in reality all polymers are viscoelastic materials. Therefore, a TPU will exhibit both an elastic response as well as a viscous “flow” that will depend on the stress duration, intensity and ambient temperature. This behavior under a long-term static stress can be characterized by means of creep tests, such as ISO 899. Here, test specimens are subjected to a static tensile stress and the strain responses are measured over time. When this test is conducted at different loads, the creep data can be used to construct an isochronous stress-strain diagram for the material.
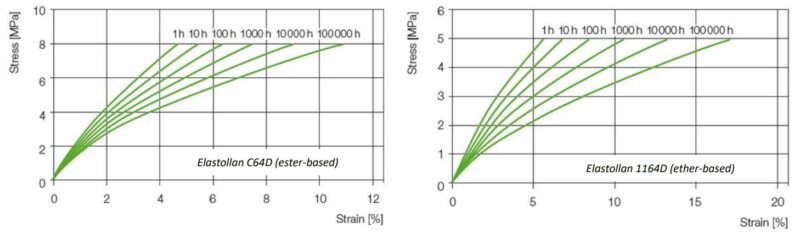
Isochronous stress-strain data at 23° C for (left) an ester-based TPU and (right) an ether-based TPU.
These calculated isochronous curves represent an “apparent” stress vs. strain response for the material as if tested for a specific amount of time. While isochronous stress-strain curves are sometimes spurned by academics, they can prove to be incredibly useful for design engineers during early product development. For example, consider the thin-walled balloon tubing application shown to the right. In the inflated condition, the balloon geometry is designed to carry a sustained hoop stress of 4 MPa. While well below the tensile strength of either of the two 61 Shore D Elastollan TPU grades, the balloon design also requires a strain limit of less than 5%. Viewing the isochronous data above, it is clear that the ester-based Elastollan C64D would satisfy this strain limit well past 100,000 hours of service. In comparison, the ether-based Elastollan 1164D reaches the 5% strain after only 10 hours of continuous stress. Clearly, more than hardness matters when it comes to designing with a TPU material.
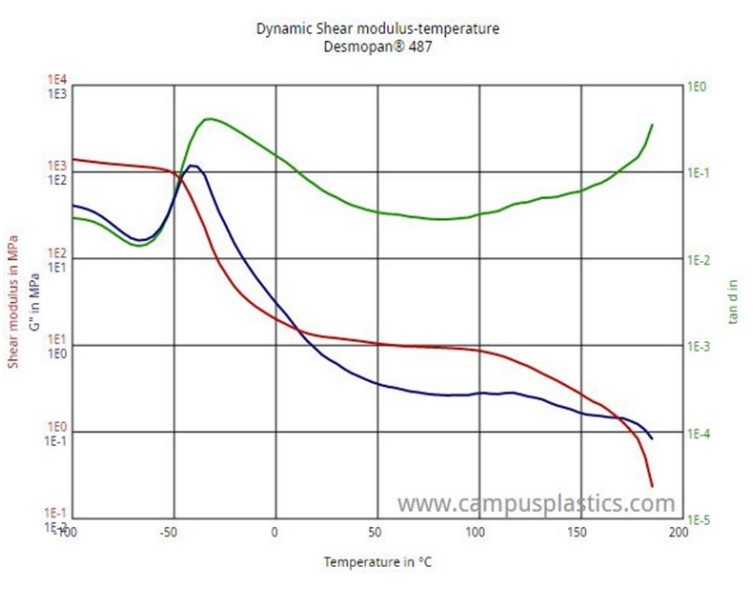
Dynamic Mechanical Analysis (DMA) for an ester-based TPU.
To more completely assess the viscoelastic properties of a polyurethane material, a Dynamic Mechanical Analysis (DMA) can be performed. This highly instrumented technique applies a sinusoidal stress to a small sample and measures the strain response. By varying the frequency of the stress or the temperature of the sample, the complex modulus can be determined as well as key transition temperatures for the material. For example, the figure to the left shows the material response to a torsion load over a range of temperatures for an ester-based Desmopan 487 TPU from Covestro. The red curve is a measure of the shear elastic modulus for the sample. The blue curve signifies the loss modulus (damping response) while the green curve (tan δ) is a measure of the ratio of the damping characteristics to the elastic response. The peak in tan δ for this TPU grade occurs at around -35 °C and signifies the glass transition temperature for the material. Below this temperature, the TPU exhibits a rigid/brittle elastic behavior. However, above this temperature the damping effects increase and the TPU exhibits a rubbery plateau. This rubber-elastic behavior continues with increasing temperature until the shear modulus rapidly decreases above approximately 150 °C when melting of the hard segments ensues. Therefore, DMA is extremely useful in understanding how a specific polyurethane material will behave over the range of temperatures that it may experience in service. Furthermore, DMA can also be used to measure the elastic-damping response as a function of frequency or even extended to provide lifetime predictions for long-term loading conditions.
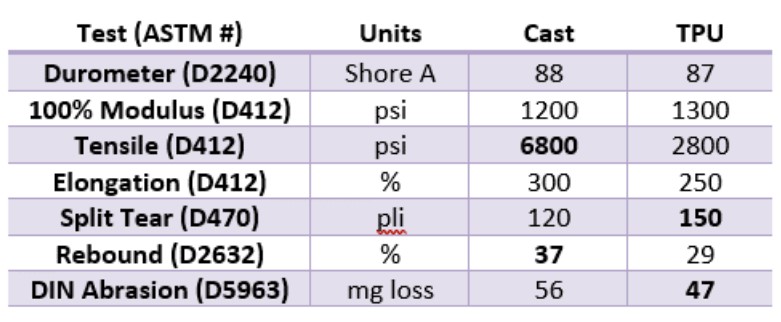
Properties for two ester-based polyurethanes.
In Part 1 of this series we also saw that it is both the underlying chemistry and the manner that the molecules are assembled that will ultimately control the end properties for the material. For example, consider the two ester-based polyurethane materials that exhibit nearly identical hardnesses of 87 Shore A. These materials were both prepared from an ester-based MDI but the first column shows a cast elastomer (chemical bonds between molecules) while the second shows a melt-processable TPU (physical bonds between molecules). While some of the properties are quite similar for the two polyurethanes, the old values show a marked advantage to the cast system for tensile strength and rebound and to the TPU for tear and abrasion resistance. In this case, the physical bonds between molecules of the TPU are able to resist distortion and breakage in tear and abrasion. Likewise, the presence of the strong chemical cross-link bonds for the cast urethane provides strength and extends the operating temperatures that can be experienced while in service.
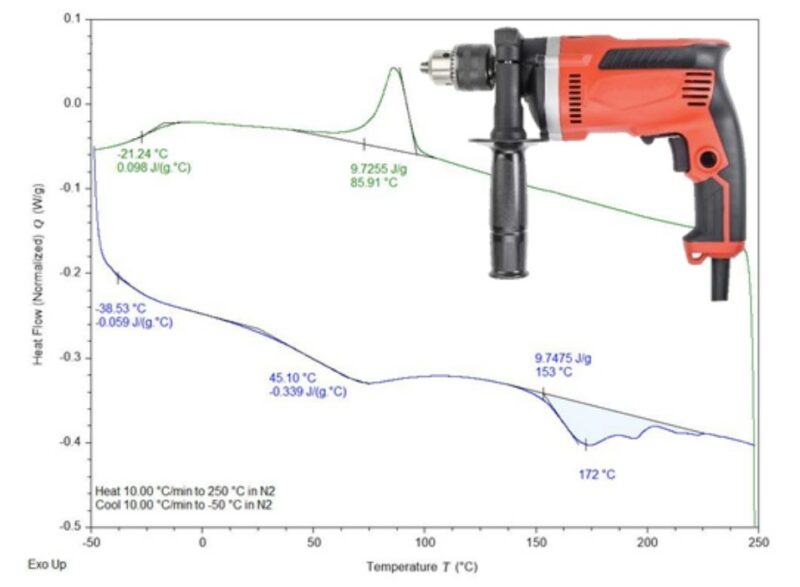
Thermal behavior for an overmolded TPU material.
To wrap up this overview of polyurethane properties, let’s further consider temperature effects on the structure and ultimately the mechanical behavior of the polymer. In this case, a TPU material was chosen for an overmolding application on an electric hand drill. The soft and resilient nature of the TPU was well-suited to provide enhanced comfort and durability for the drill over the expected service temperatures of -20 to 50°C. However, it was found that the TPU experienced dimensional changes and “hardening” during accelerated testing of the drill at elevated temperatures. Differential Scanning Calorimetry (DSC) testing of the TPU resin showed an expected melting temperature (Tm) of 172°C. However, the testing also showed that this particular thermoplastic polyurethane experiences a glass transition temperature (Tg) in the hard block segments at 45°C as well as the potential for recrystallization at temperatures approaching 50°C. The observed dimension changes and “hardening” of the overmolding was an artifact of the TPU molecules realigning while in service to cause physical changes in the properties. This effect is why some TPU grades may actually benefit from an “annealing” step following the molding process. However, that discussion is best left to the final installment of this whitepaper series on Polyurethanes: Where Rubber Meets the Road when we’ll examine when things go wrong and failures occur.